


 44 / 132

Atul Ltd | Annual Report 2010-11
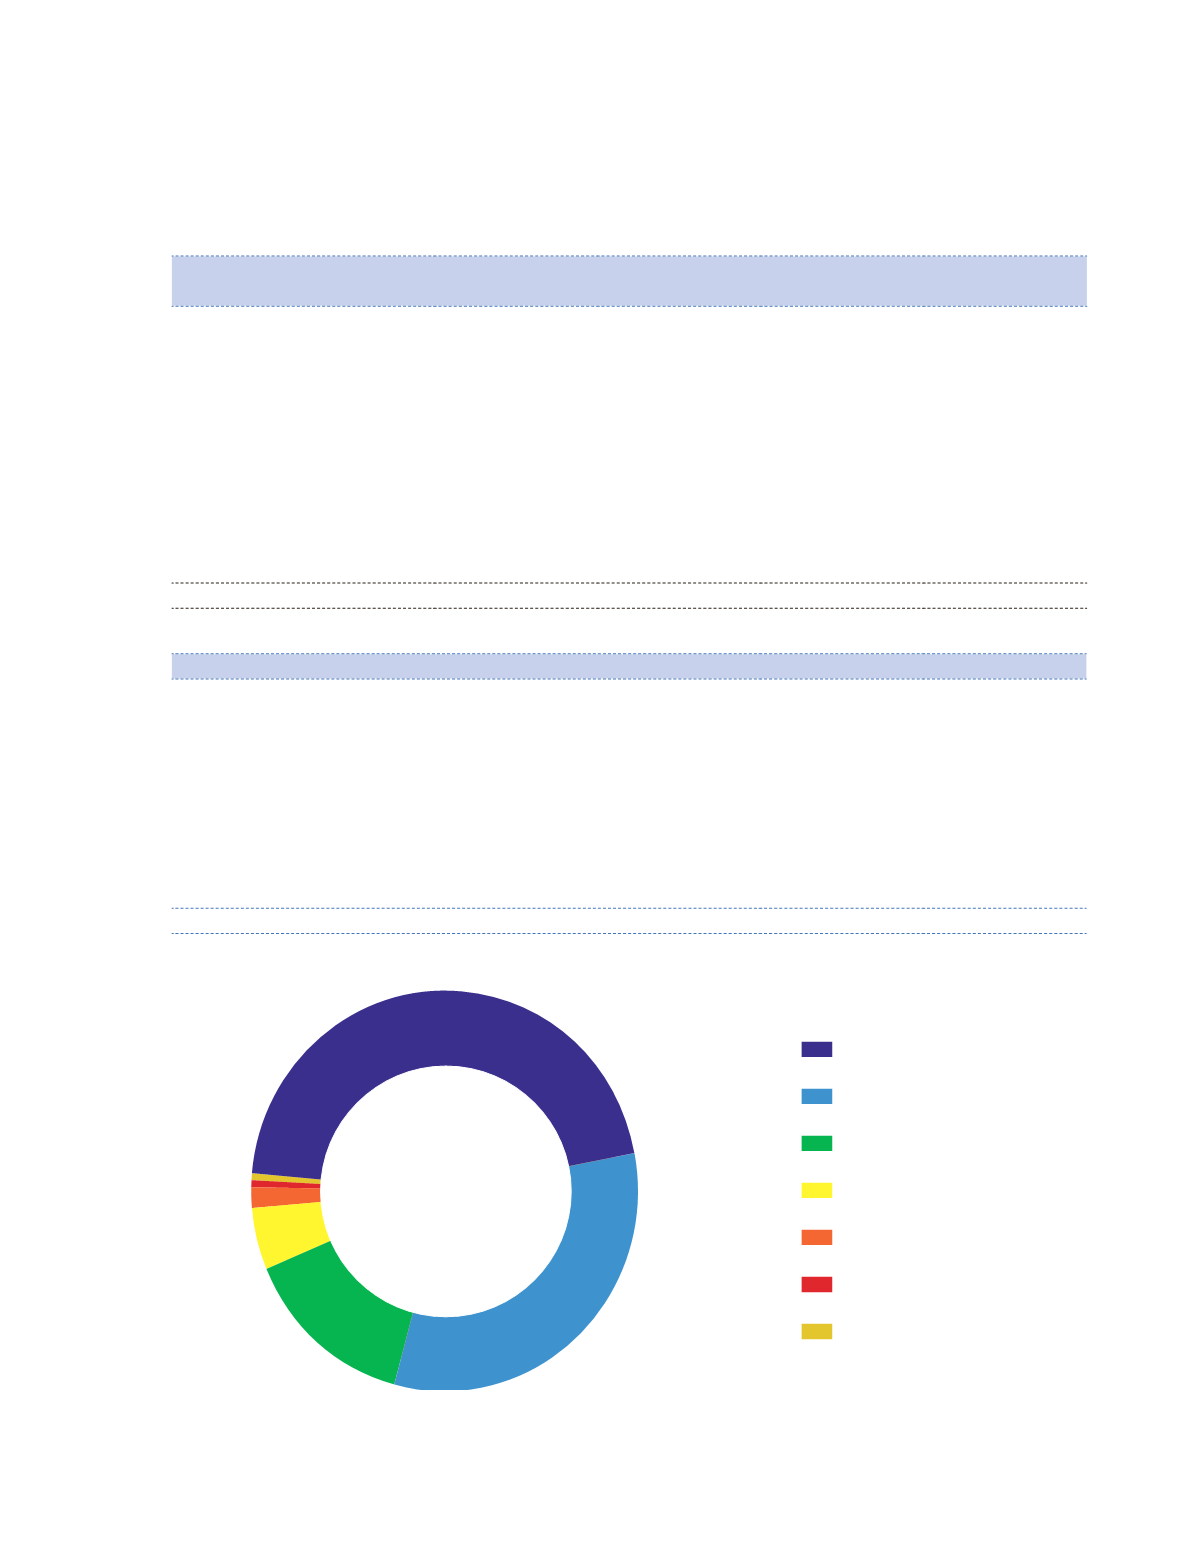
45.66
32.29
14.39
4.91
1.82
0.53
0.40
Mutual Funds
Insurance Companies
Corporate Bodies
Indian Public
Promoters
Banks
NRIs
7.11 Distribution of Shareholding as on March 31, 2011
i) Shareholding wise:
Holding
Shareholders
Shares
Numbers
% of Total
Numbers
% of Total
1 – 10
4533
13.43
24079
0.08
11 – 50
13095
38.80
370680
1.25
51 – 100
5825
17.26
498253
1.68
101 – 500
7617
22.57
1899133
6.40
501 – 1000
1326
3.93
1013822
3.42
1001 – 2000
616
1.83
919886
3.10
2001 – 3000
219
0.65
556014
1.88
3001– 4000
97
0.29
348849
1.18
4001 – 5000
90
0.27
422921
1.42
5001 – 10000
158
0.47
1162387
3.92
10001 and above
168
0.50
22445709
75.67
Total
33744
100.00
29661733
100.00
ii)
Category wise
Category
Shares (Numbers) Shareholding (%)
Promoters
1,35,45,114
45.66
Mutual Funds
5,40,750
1.82
Banks
1,17,371
0.40
Insurance Companies
14,55,483
4.91
Foreign Institutional Investors
900
–
Corporate Bodies
42,66,864
14.39
Non-Resident Indians | Overseas Corporate Bodies
1,56,523
0.53
State Government
336
–
Indian Public
95,78,392
32.29
Total
2,96,61,733
100.00
Shareholding (%)