


 158 / 220

Atul Ltd | Annual Report 2017-18
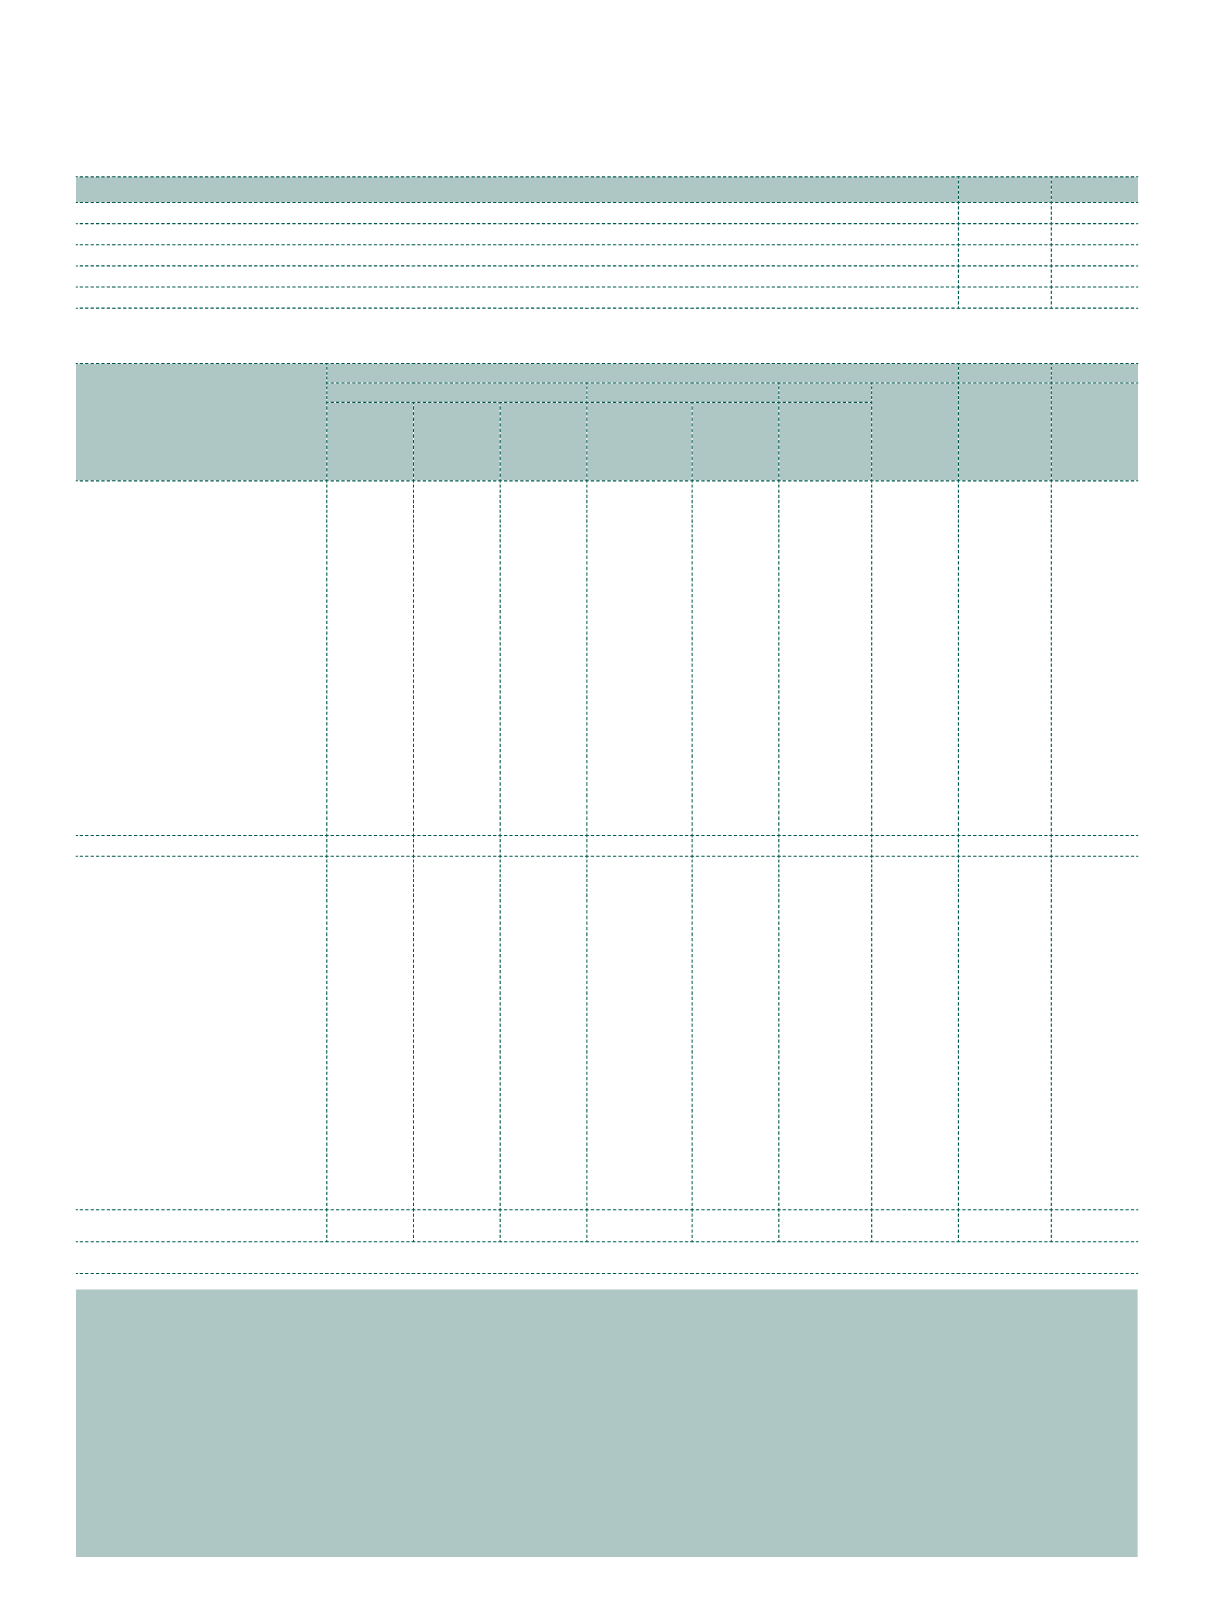
Consolidated Statement of changes in equity
for the year ended March 31, 2018
A Equity share capital
(
`
cr)
Particulars
Note Amount
As at March 31, 2016
29.68
Changes in Equity share capital during the year
–
As at March 31, 2017
29.68
Changes in Equity share capital during the year
–
As at March 31, 2018
15
29.68
B Other equity
(
`
cr)
Particulars
Attributable to owners of the Company
Reserves and surplus
Other reserves
Total
other
equity
Non-
controlling
interest
Total
Securities
premium
reserve
General
reserve
Retained
earnings
FVOCI
equity
instruments
Cash flow
hedging
reserve
Foreign
currency
translation
reserve
As at March 31, 2016
34.66
97.36 1,156.81 287.52
(0.59)
9.35 1,585.11
2.45 1,587.56
Profit for the year
–
– 322.97
–
–
– 322.97
0.38 323.35
Other Comprehensive Income
–
–
1.58
77.36
(0.48)
4.45
82.91
0.01
82.92
Total comprehensive
income for the year
–
– 324.55
77.36
(0.48)
4.45 405.88
0.39 406.27
Transfer to retained
earnings on disposal of
FVOCI equity instruments
–
–
0.75
(0.75)
–
–
–
–
–
Hedging gain | (loss)
reclassified to Statement of
Profit and Loss
–
–
–
–
0.59
–
0.59
0.59
Transactions with
owners in their capacity
as owners:
Dividend paid (including
dividend distribution tax)
–
–
(37.02)
–
–
–
(37.02)
– (37.02)
Transactions with
non-controlling interests
–
–
(18.30)
–
–
–
(18.30)
12.41
(5.89)
As at March 31, 2017
34.66
97.36 1,426.79
364.13
(0.48)
13.80 1,936.26
15.25 1,951.51
Profit for the year
–
– 276.48
–
–
– 276.48
4.76 281.24
Other Comprehensive Income
–
–
1.76
37.28
0.03
5.06
44.13
–
44.13
Total comprehensive
income for the year
–
– 278.24
37.28
0.03
5.06 320.61
4.76 325.37
Transfer to retained
earnings on disposal of
FVOCI equity instruments
–
–
1.59
(1.59)
–
–
–
–
–
Hedging gain | (loss)
reclassified to Statement of
Profit and Loss
–
–
–
–
0.48
–
0.48
–
0.48
Transactions with
owners in their capacity
as owners:
Dividend paid (including
dividend distribution tax)
–
–
(38.51)
–
–
–
(38.51)
–
(38.51)
Non-controlling interest on
acquisition of subsidiary
companies
–
–
(4.60)
–
–
–
(4.60)
–
(4.60)
As at March 31, 2018
34.66
97.36 1,663.51
399.82
0.03
18.86 2,214.24
20.01 2,234.25
The accompanying Notes 1-29 form an integral part of the Consolidated Financial Statements
In terms of our report attached
For Deloitte Haskins & Sells LLP
Chartered Accountants
R A Shah
S S Baijal
B S Mehta
H S Shah
S M Datta
V S Rangan
M M Chitale
S A Panse
B R Arora
Directors
For and on behalf of the Board of Directors
S S Lalbhai
Chairman and Managing Director
S A Lalbhai
Managing Director
Mumbai
April 27, 2018
Samir R. Shah
Partner
Mumbai
April 27, 2018
T R Gopi Kannan
Whole-time Director and CFO
L P Patni
Company Secretary
B N Mohanan
Whole-time Director
and President - U&S