


 15 / 132

Application of Funds
Fixed Assets
During the year, the Company invested
`
22 crores in
fixed assets. The segment-wise spends are outlined
below:
Depreciation
Depreciation increased by 3% over the previous year,
corresponding to the increase in plant, machinery and
building. Cumulative depreciation as a part of total
gross block was 60%.
Investments
The Company invested most of its operational surplus
in its business except for
`
8.30 crores invested for
acquiring strategic shareholding in new businesses.
An amount of
`
10 crores was invested as Promoter’s
contribution in the form of Preference Shares (by
conversion of loans already made) in an associate
company. Other investments remained unchanged at
`
65 crores.
Inventories
Inventories constituted 35% of the current assets as
on March 31, 2011. Inventories increased by 23% to
`
261 crores mainly due to increase in sales of 29%.
Inventories holding days reduced by 3 days to 63
days.
`
crores
Segment
Life Science Chemicals
Performance & Other Chemicals
Unallocable
5
11
6
12 I 13
0
100
200
300
400
500
600
700
800
900
2010-11
2009-10
2008-09
2007-08
2006-07
0
2
4
6
8
10
12
14
16
18
20
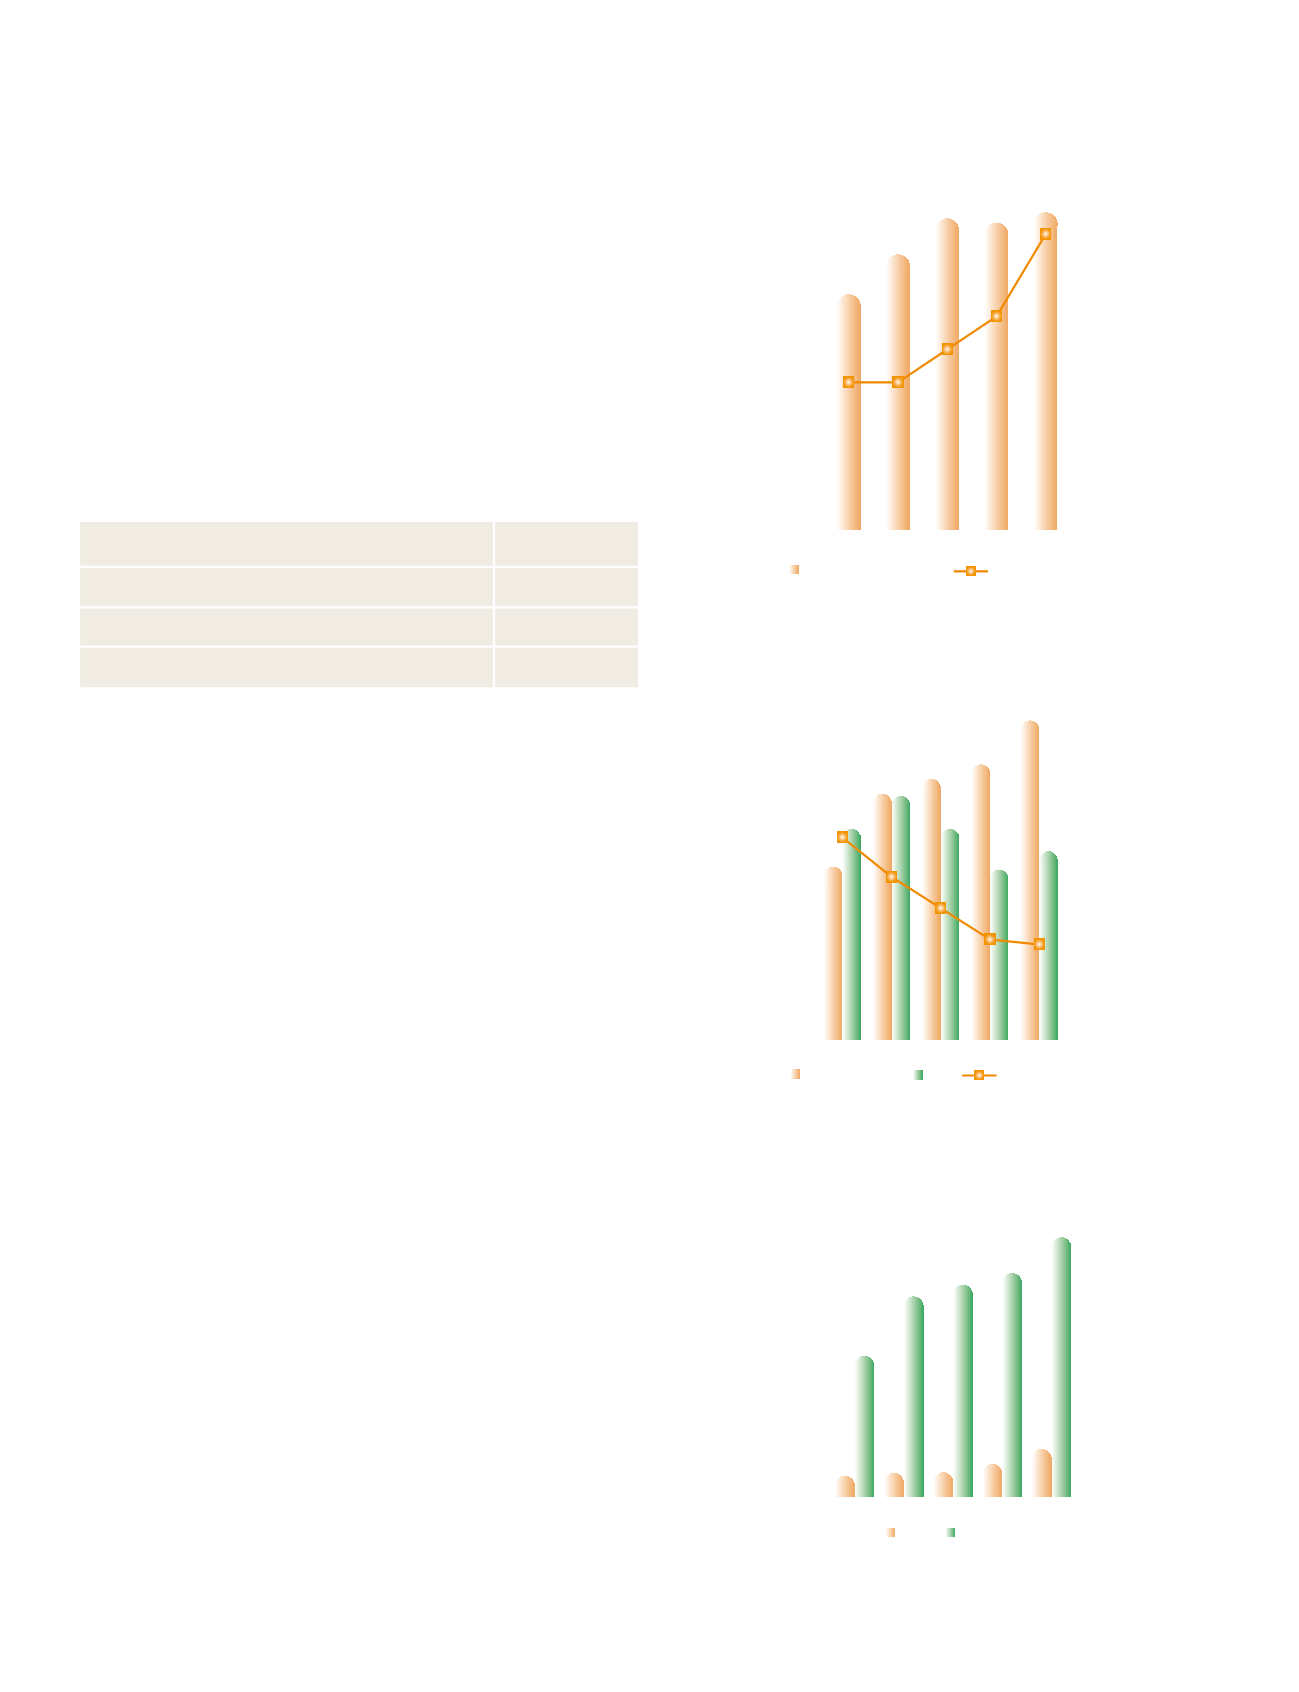
Return on Average Capital Employed
613
9% 9%
11%
13%
18%
`
crores
%
722
822
810
837
Average Capital Employed+
Return on Average
Capital Employed %+*
+ Excluding capital work in progress
* Excluding exceptional income | expenses
0
100
200
300
400
500
600
2010-11
2009-10
2008-09
2007-08
2006-07
0.0
0.5
1.0
1.5
2.0
Debt-Equity
300
1.23
0.99
0.80
0.61 0.58
`
crores
369
428
368
295
328
433
459
485
567
Debt
Shareholders’Equity
Debt-Equity Ratio
0
50
100
150
200
250
2010-11
2009-10
2008-09
2007-08
2006-07
EPS and Book Value per Share
101
10
12
13
19
30
146
155
164
191
Book value
EPS
CAGR
EPS - 35%
BookValue - 16%
`