


 66 / 236

Atul Ltd | Annual Report 2016-17
Pursuant to Regulation 40(9) of the Securities and Exchange Board of India (Listing Obligations and Disclosure
Requirements) Regulations, 2015, certificates on a half-yearly basis were issued by the Company Secretary in practice for
due compliance of share transfer formalities by the Company. Pursuant to the Securities and Exchange Board of India
(Depositories and Participants) Regulations, 1996, certificates were also received from the Company Secretary in practice
for timely dematerialisation of the shares and for conducting the Secretarial Audit on a quarterly basis for reconciliation
of the share capital of the Company. All the certificates were filed with the Stock Exchanges where the shares of the
Company are listed.
7.11 Distribution of shareholding as on March 31, 2017
7.11.1 Shareholding-wise:
Holding
Shareholders
Shares
Numbers
% of total
Numbers
% of total
1 – 10
6,964
23.19
36,548
0.12
11 – 50
11,636
38.75
3,18,737
1.08
51 – 100
4,140
13.79
3,42,977
1.16
101 – 500
5,374
17.89
12,83,017
4.33
501 – 1,000
946
3.15
7,00,476
2.36
1,001 – 2,000
407
1.36
5,87,463
1.98
2,001 – 3,000
150
0.50
3,74,700
1.26
3,001 – 4,000
78
0.26
2,79,813
0.94
4,001 – 5,000
58
0.19
2,70,418
0.91
5,001 – 10,000
107
0.36
7,80,240
2.63
10,001 and above
171
0.57
2,46,87,344
83.23
Total
30,031
100.00
2,96,61,733
100.00
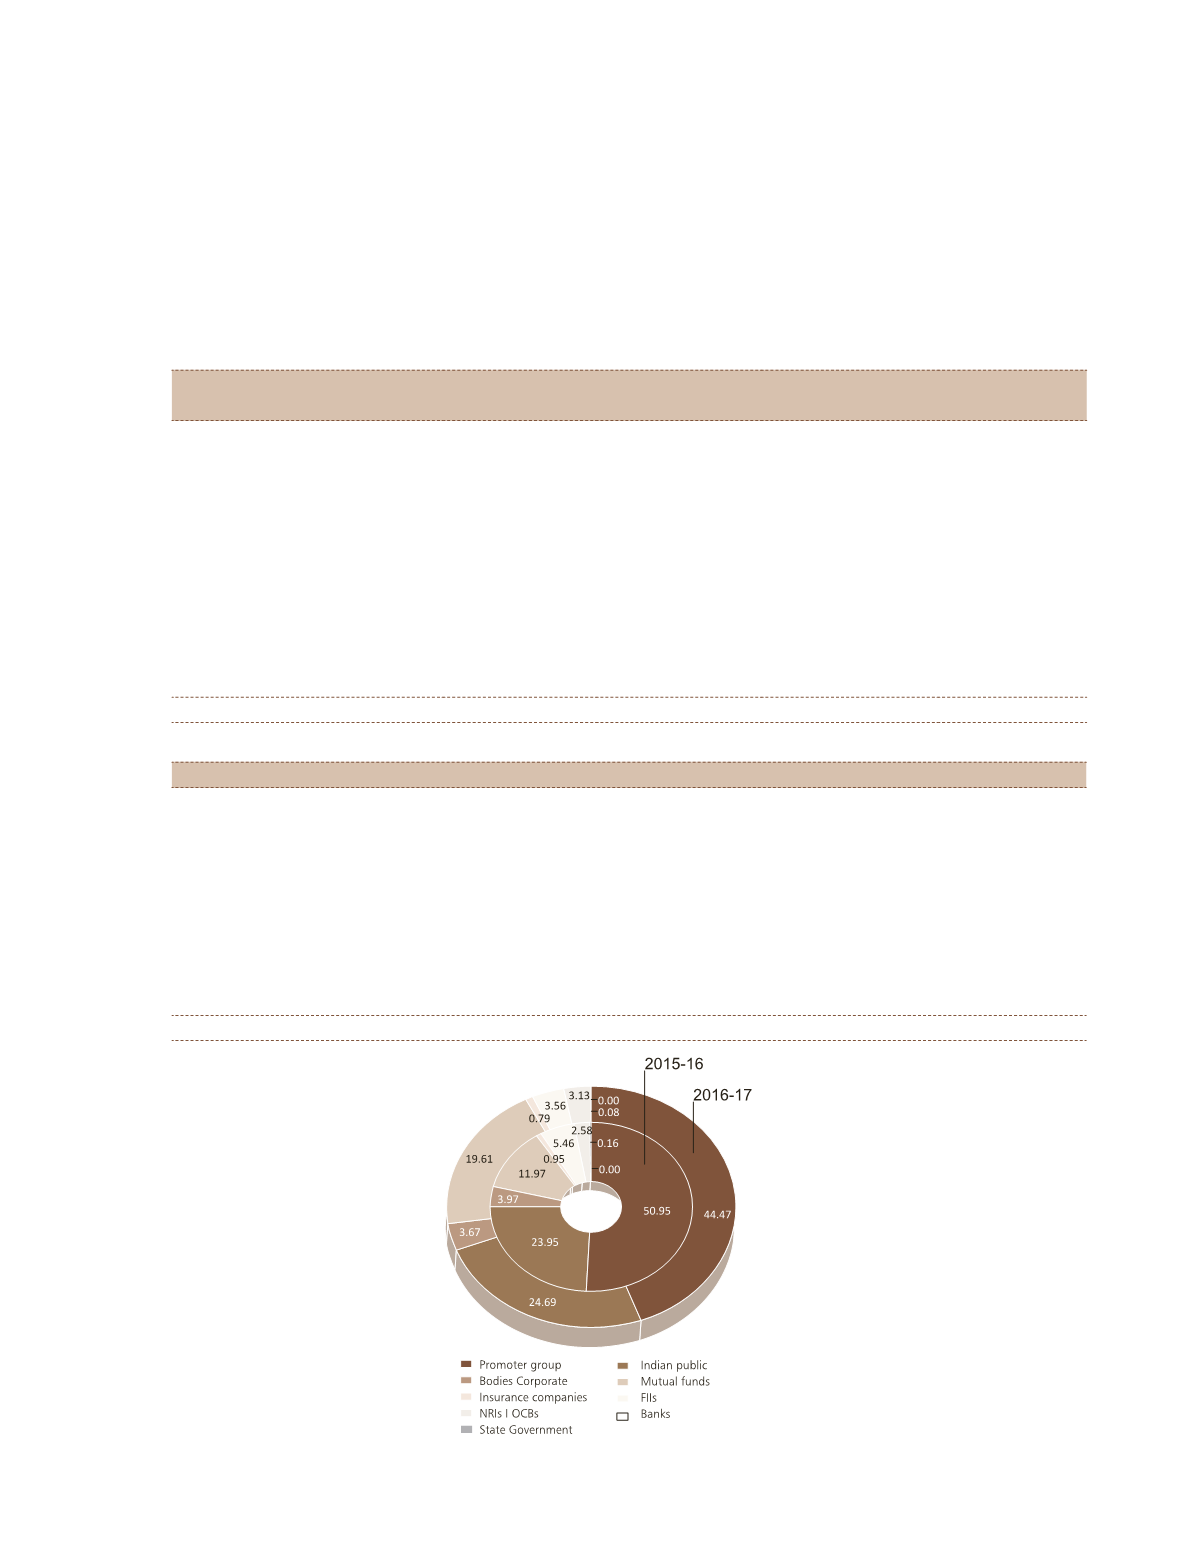
7.11.2 Category-wise:
Category
Shares (Numbers) Shareholding (%)
Promoter group
1,31,91,639
44.47
Indian public
73,22,488
24.69
Bodies corporate
10,88,212
3.67
Mutual funds
58,15,518
19.61
Insurance companies
2,35,935
0.79
Foreign institutional investors
10,54,623
3.56
Non-resident Indians | Overseas bodies corporate
9,28,956
3.13
Banks
24,026
0.08
State Government
336
0.00
Total
2,96,61,733
100.00