


 24 / 38

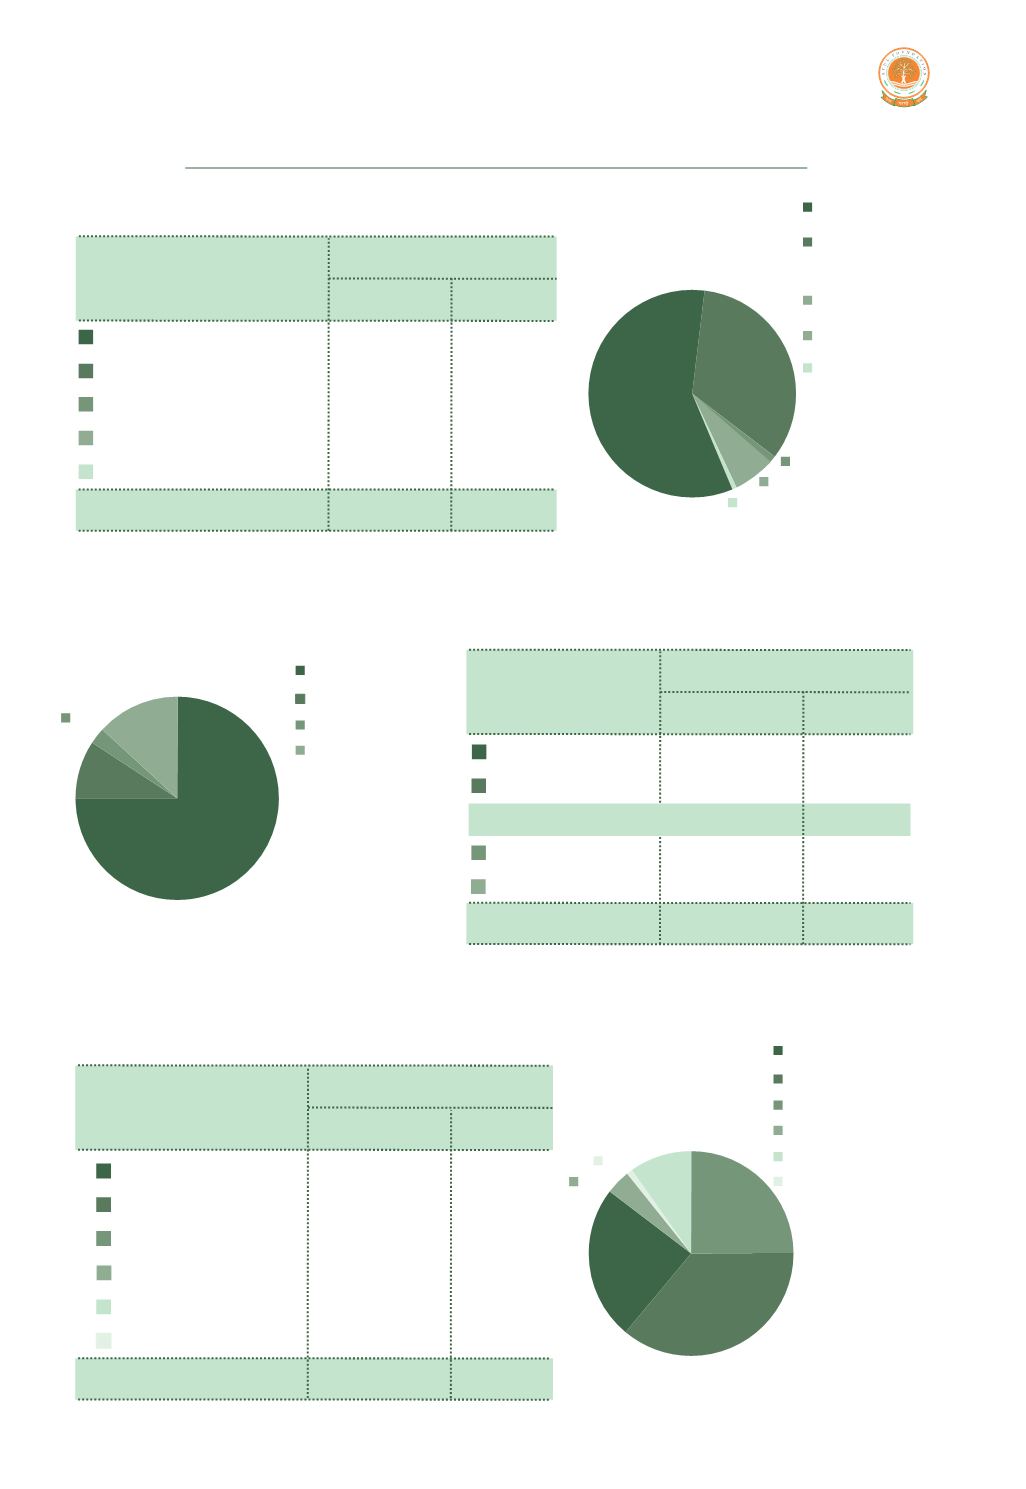
Financial highlights
34%
58%
1%
1%
Companies
.
Government
grants
.
Donation-others
.
Interest income
.
Miscellaneous
income
6%
Where the monies came from
Companies
Government grants
Donation-others
Interest income
Miscellaneous income
891.82
511.92
21.55
92.86
9.48
1,527.68
58.38%
33.51%
1.41%
6.08%
0.62%
Particulars
`
lakhs
%
Amount received
How the monies were used
Particulars
Programs
Asset creation
Administration
Unspent
1,132.98
155.00
39.86
199.84
1,527.68
74.16%
10.15%
84.31%
2.61%
13.08%
Amount used
%
`
lakhs
74%
10%
13%
3%
Programs
Asset creation
Administration
Unspent
On which programs the monies were spent
Particulars
Education
Empowerment
Health
Relief
Infrastructure
Conservation
`
lakhs
%
Amount spent
319.51
462.33
320.95
49.21
123.61
12.38
1,287.98
24.81%
35.89%
24.92%
3.82%
9.60%
0.96%
1%
4% 9%
25%
25%
36%
Education
Empowerment
Health
Relief
Conservation
Infrastructure
23
100%
100%
100%