


 27 / 40

25
Financial highlights
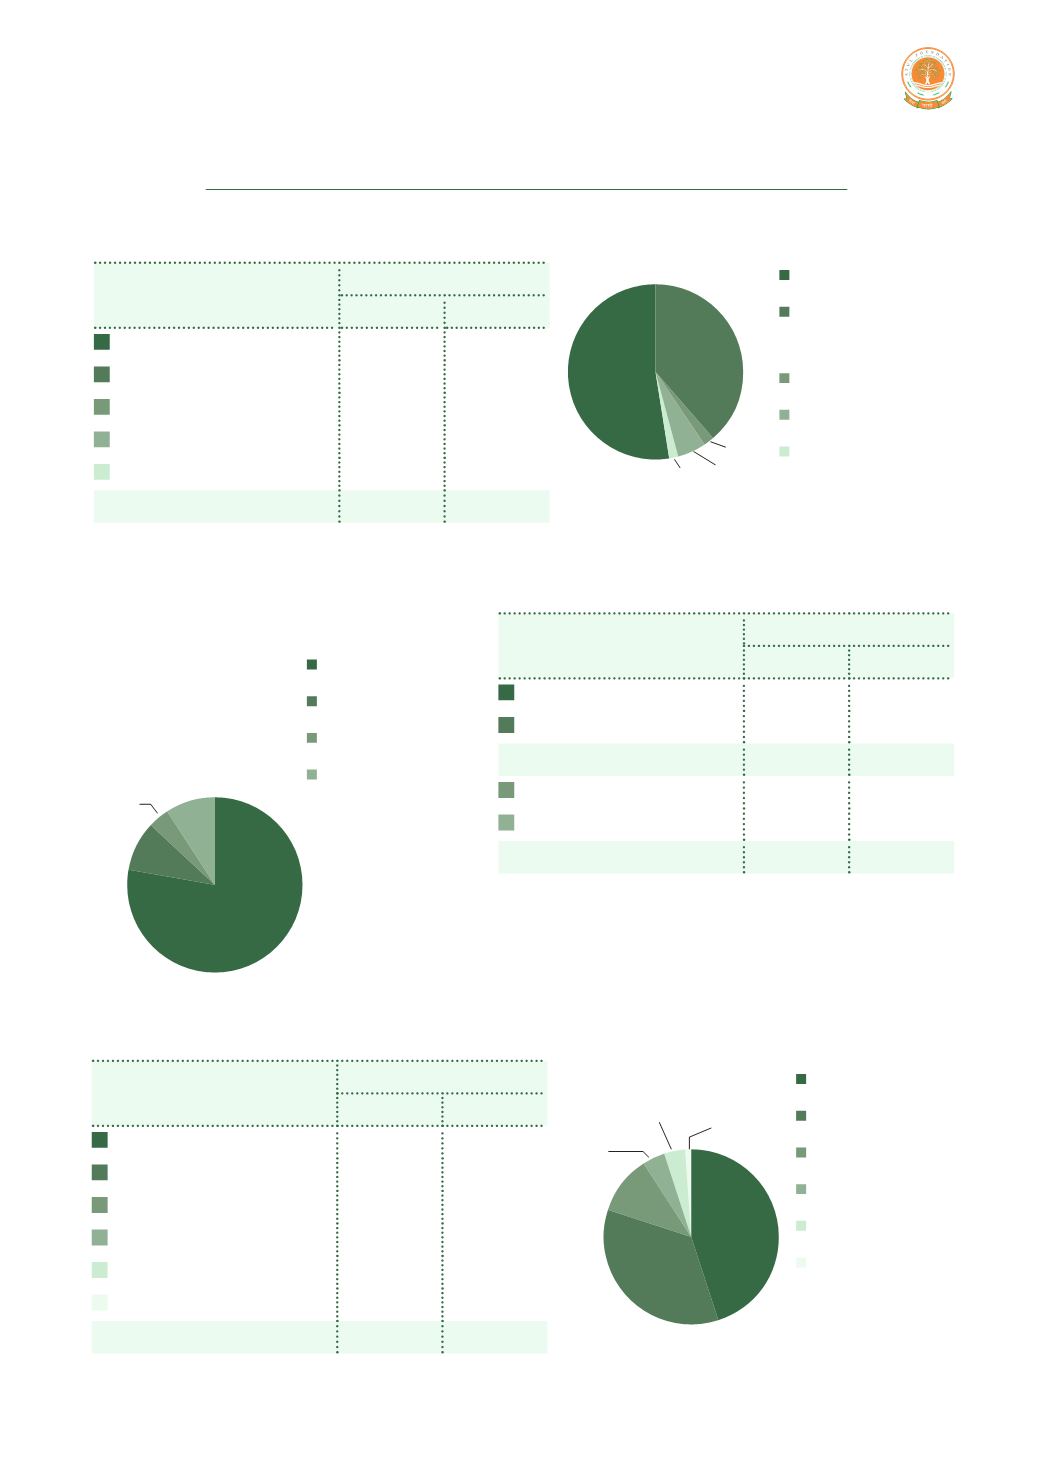
Where the monies came from
Particulars
Amount received
`
lakhs
%
Companies
1,039.57
52.46%
Government grants
770.54
38.88%
Donation-others
36.34
1.83%
Interest income
101.61
5.13%
Miscellaneous income 33.56
1.69%
1,981.61
100%
On which programs the monies were spent
Particulars
Amount spent
`
lakhs
%
Education
776.42
45.02%
Empowerment
605.32
35.10%
Health
196.54
11.40%
Relief
60.98
3.54%
Infrastructure
72.18 4.19%
Conservation
13.06
0.76%
1,724.48
100%
Particulars
Amount used
`
lakhs
%
Programs
1,544.02
77.92%
Asset creation
180.46
9.11%
1,724.48
87.02%
Administration
71.92
3.63%
Unspent
185.21
9.35%
1,981.61
100%
Programs
Asset creation
Administration
Unspent
Companies
Government
grants
Donation-others
Interest income
Miscellaneous
income
39%
52%
2%
5% 2%
78%
9%
4%
9%
Education
Empowerment
Health
Relief
Infrastructure
Conservation
45%
35%
11%
4%
1%
4%
How the monies were used