


 17 / 136

Corporate Identity Serving Diverse Industries Purpose and Values Overview by the Chairman Operational Highlights
Financial Analysis
Research and Technology
Safety, HealthandEnvironment Serving the Society Directors’ Report Management Discussion andAnalysis Report on Corporate Governance Financial Statements
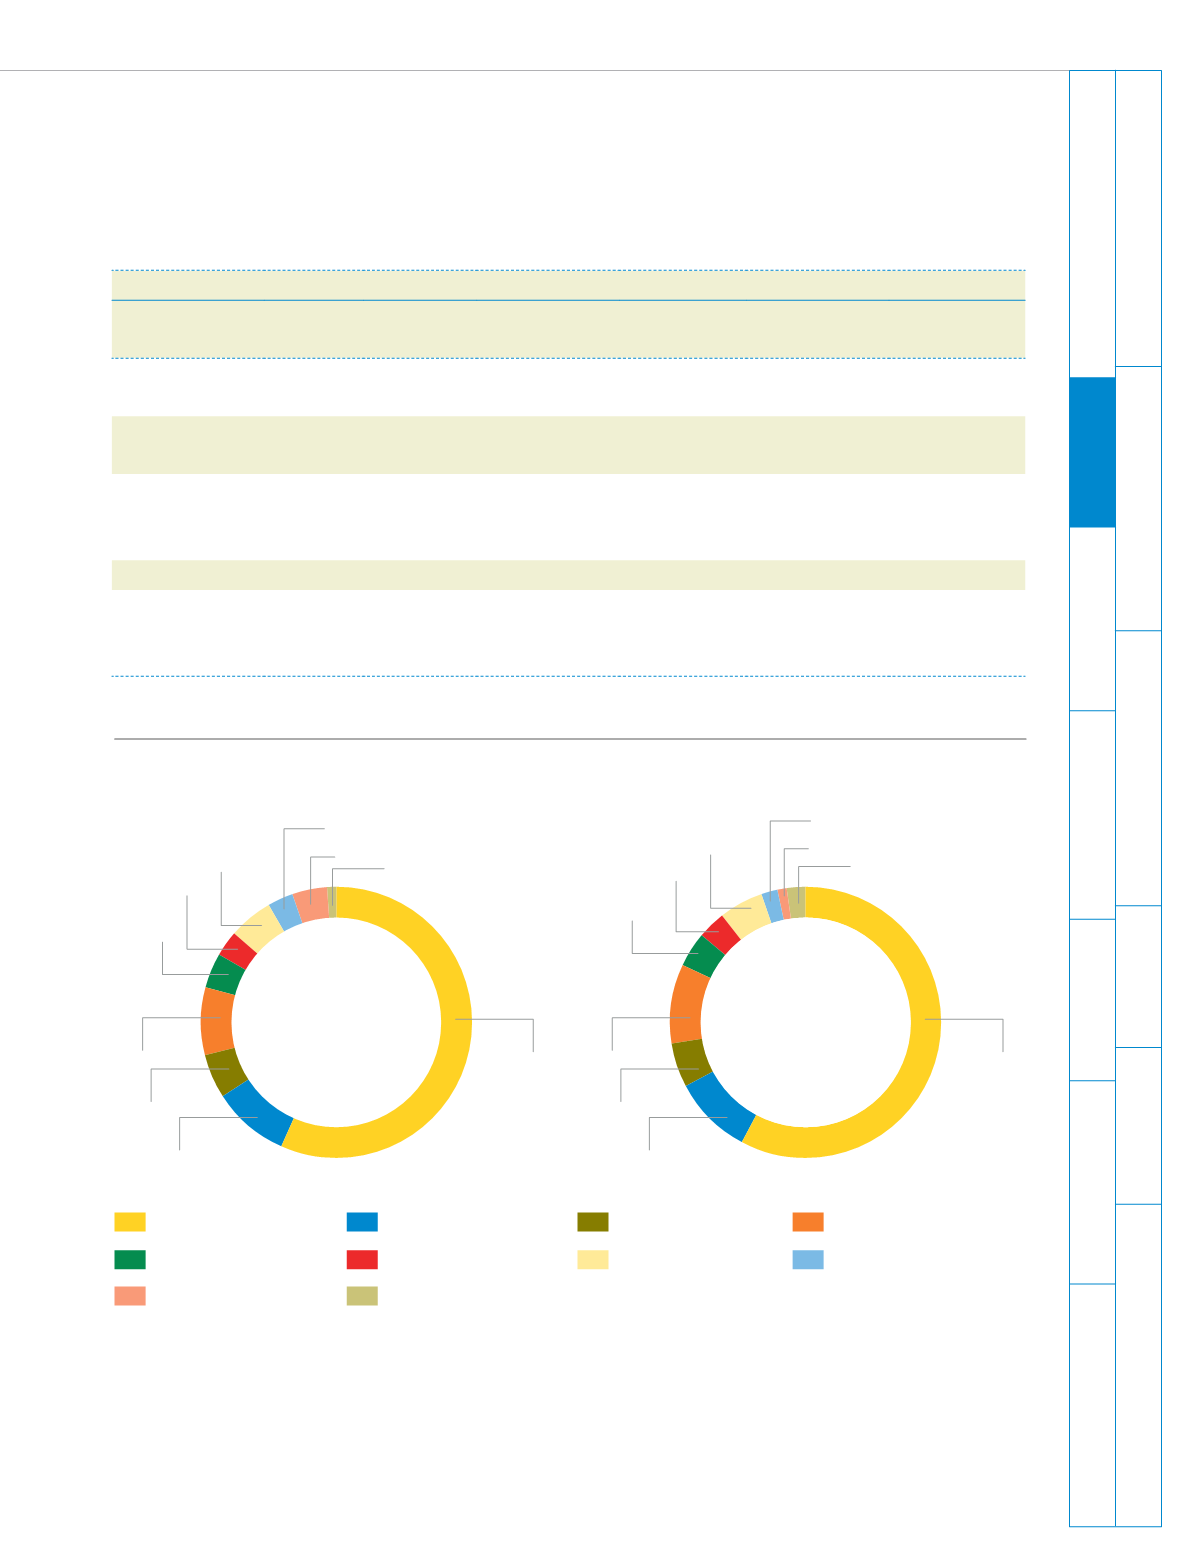
Expenditure
Total expense (excluding tax) decreased by 3% in terms of percentage of total operating revenues and by 2.3% in absolute
terms over the previous year. This was mainly on account of reduction in interest cost by 38% and foreign exchange loss
by 79% compared to the previous year. However, employee cost for the year was higher by 14% which was in line with the
general increase in cost of manpower in the country.
Revenue Analysis (Rs Crores)
Segment
Colors
Specialty and Other Chemicals
Particulars
Colors
Aromatics
Bulk Chemicals
and Intermediates
Crop
Protection
Pharmaceuticals
and Intermediates
Polymers
Operating
revenues
292
284
68
247
69
223
Growth over the
previous year
10% -6%
-16%
-2%
-7%
15%
Share as a part
of the Company
revenues
24% 24%
6%
21%
6%
19%
Export
122
171
19
124
48
29
Export growth
over the previous
year
3% -15%
7%
-14%
-19%
-19%
Raw materials
Employees
Repairs and maintenance
Exchange differences
Selling and distribution
Power, fuel and water
Tax
Depreciation
Others
Interest and finance charges
55
9
5
8
4
3
5
3
4
1
2008-09
55
9
5
9
4
3
5
2
1
2
2009-10
(%)
Individual expense heads as a percentage of operational revenues: