


 14 / 132

Financial Analysis
Highlights
Sales up by 29% to
`
1508 crores
Profit before tax and exceptional items up from
`
80 crores to
`
129 crores
Profit after tax up from
`
53 crores to
`
96 crores
Return on average capital employed up from
13% to 18%
Sources of Funds
Capital
The Company has a paid up share capital of
`
29.67
crores comprising 2,96,61,733 Equity Shares of
`
10
each as of March 31, 2011.
Reserves and Surplus
Reserves and surplus increased by 18% to
`
537
crores during the year owing to profit earned.
Loan Funds
Borrowings increased by 11% to
`
328 crores as a
result of higher working capital employed due to
growth in sales of
`
340 crores and also payments
towards capital expenditure of
`
47 crores. Secured
loans constituted 90% of the total. Of the secured
loans, 48% was for funding additional working
capital; the balance was for projects. Foreign
currency loans constituted 34% of the total debt. The
Company remained reasonably geared with the ratio
of total debt to total equity at 0.58:1.
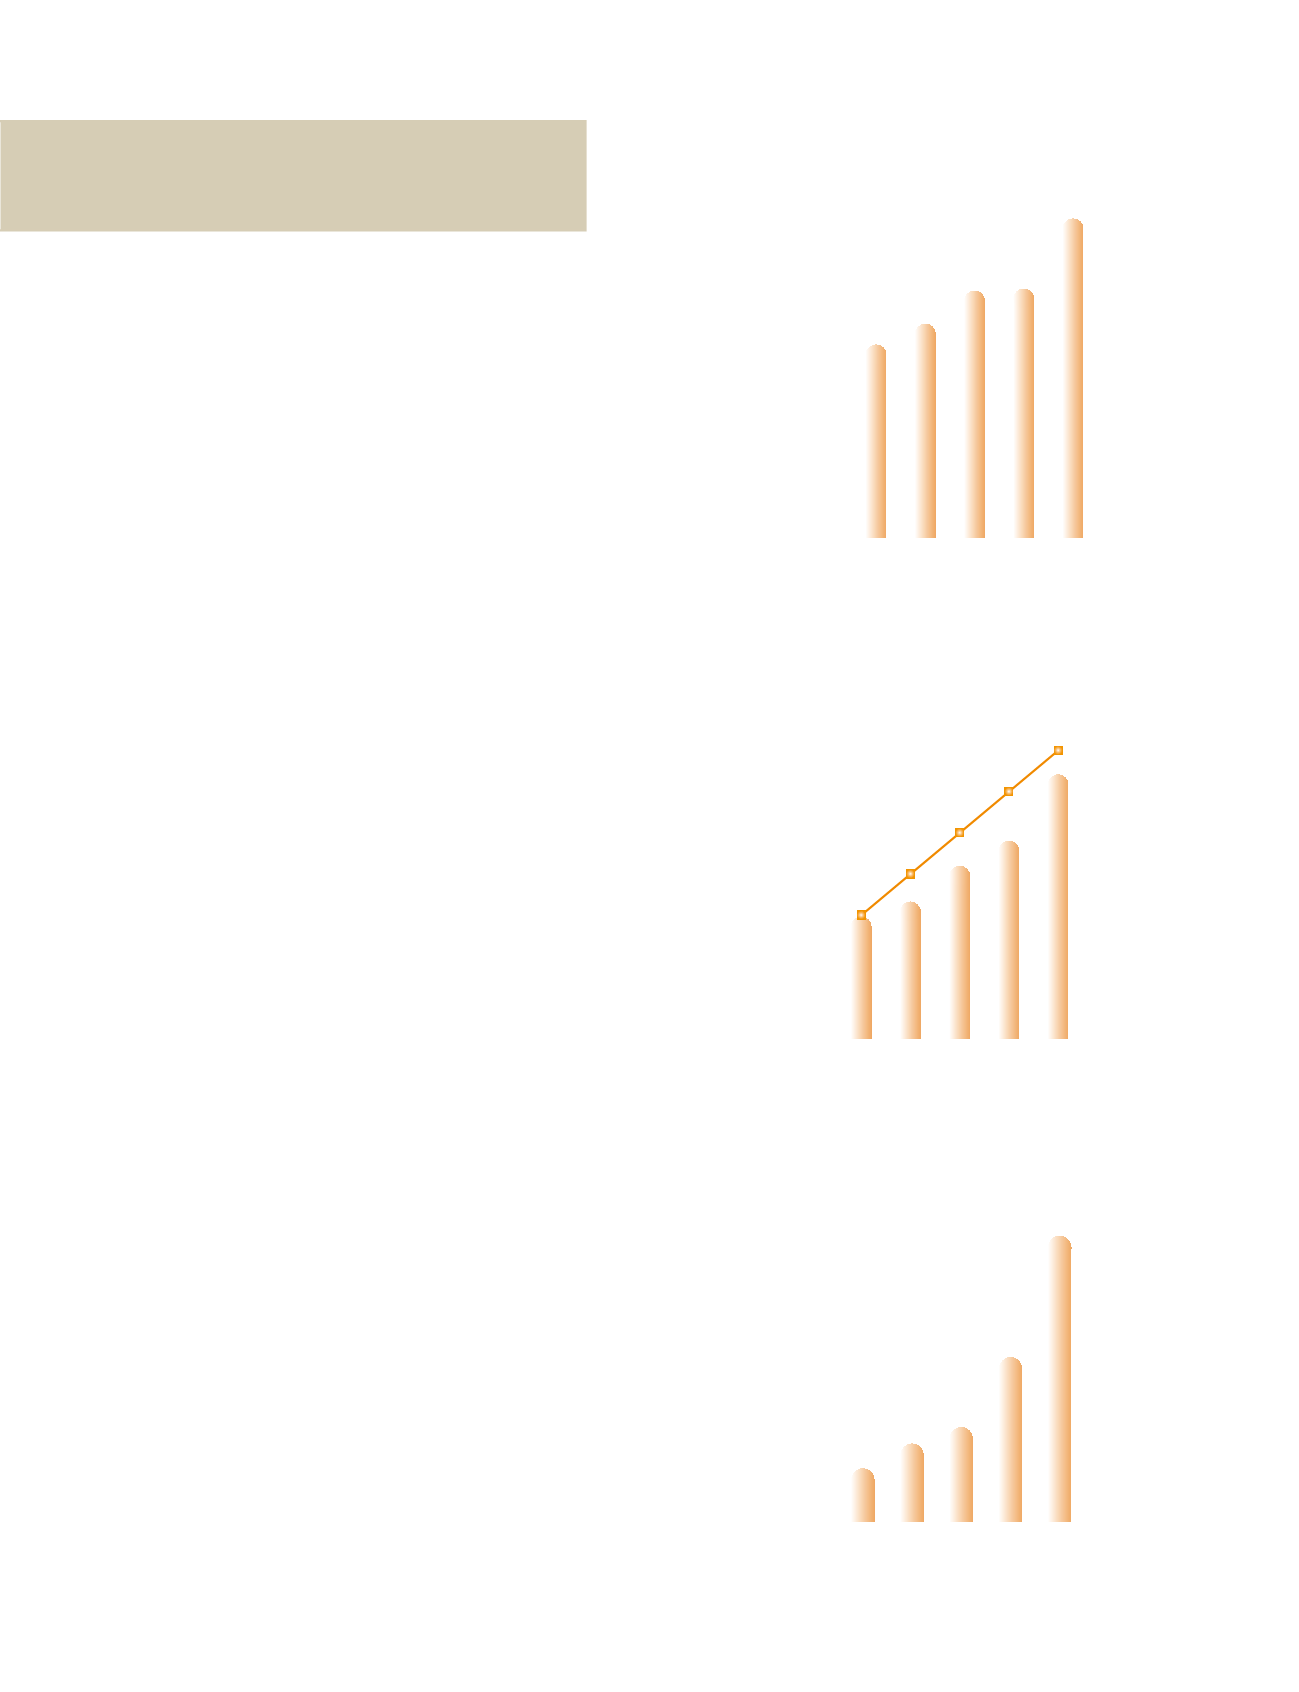
0
200
400
600
800
1000
1200
1400
1600
2010-11
2009-10
2008-09
2007-08
2006-07
Sales
`
crores
CAGR: 13%
895
998
1159
1168
1508
0
50
100
150
200
250
2010-11
2009-10
2008-09
2007-08
2006-07
6
8
10
12
14
Operating Profit (PBIDT)
9%
10%
11%
12%
13%
`
crores
%
85
97
124
143
193
CAGR: 20%
0
20
40
60
80
100
120
140
160
2010-11
2009-10
2008-09
2007-08
2006-07
Profit Before Tax
26
`
crores
38
46
80
139
CAGR: 47%
Atul Ltd I Annual Report 2010-11