


 18 / 168

`
cr
%
`
cr
%
0
50
100
150
200
250
300
350
400
450
0
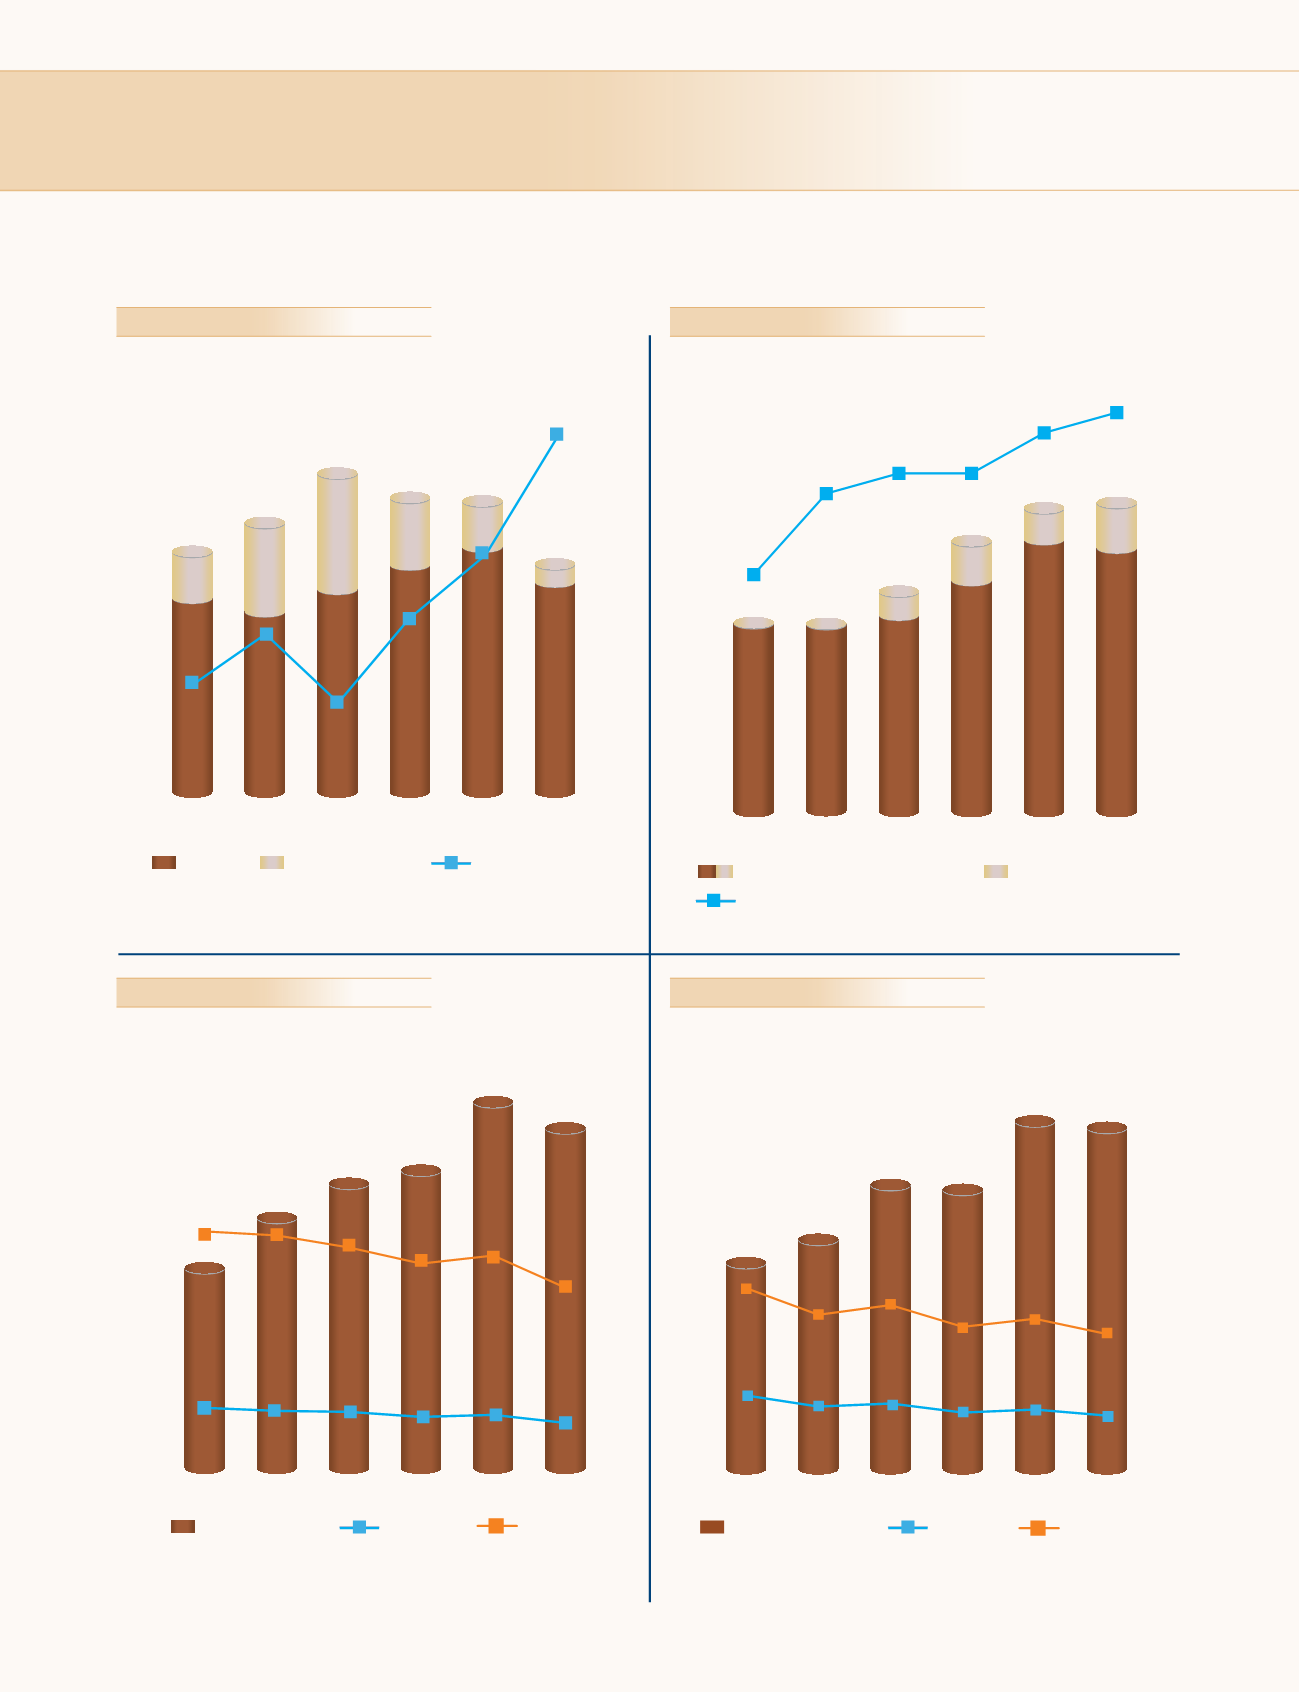
18
2010-11
2009-10
230
5.5
4.7
11.7
16.3
215
240
267
287
248
2011-12 2012-13
Foreign currency
Interest coverage ratio
2013-14 2014-15
Rupee
65
112
142
88
64
33
7.5
8.4
3
6
9
12
15
`
cr
`
cr
0.0
0.2
0.4
0.6
0.8
1.0
1.2
1.4
1.6
1.8
2.0
1,232 1,241
974
1.2
1.6
1.7
1.7
1.9
2.0
* Excluding capital work-in-progress
Fixed assets turnover ratio
Additions during the year
Gross block*
1,044
1,156
972
2010-11
2009-10
2011-12 2012-13 2013-14 2014-15
500
800
1100
1500
22
25
949
950
965
1,042
1,136
1,114
79
114
96
127
0
50
100
150
200
250
300
350
400
0
5
10
15
20
25
30
18.1%
211
66
63
62
57
59
51
261
295
308
350
376
17.3%
16.9%
15.7% 16.3%
13.9%
Inventories
NoDs
% to sales
2010-11
2009-10
2011-12 2012-13 2013-14 2014-15
0
50
100
150
200
250
300
350
400
450
500
0
10
20
30
40
50
271
79
68
71
62
65
59
300
368
362
447
439
19.9%
23.2%
21.1%
18.4% 19.4%
17.5%
Trade receivables
NoDs
% to sales
2010-11
2009-10
2011-12 2012-13 2013-14 2014-15
Financial charts
Borrowings
Fixed assets
Inventories
Trade receivables
Atul Ltd | Annual Report 2014-15