


 19 / 168

`
cr
`
cr
`
cr
`
cr
0
100
200
300
400
500
600
700
800
900
1,000
0.0
0.20
0.40
0.60
0.80
1.00
2010-11
2009-10
2011-12 2012-13
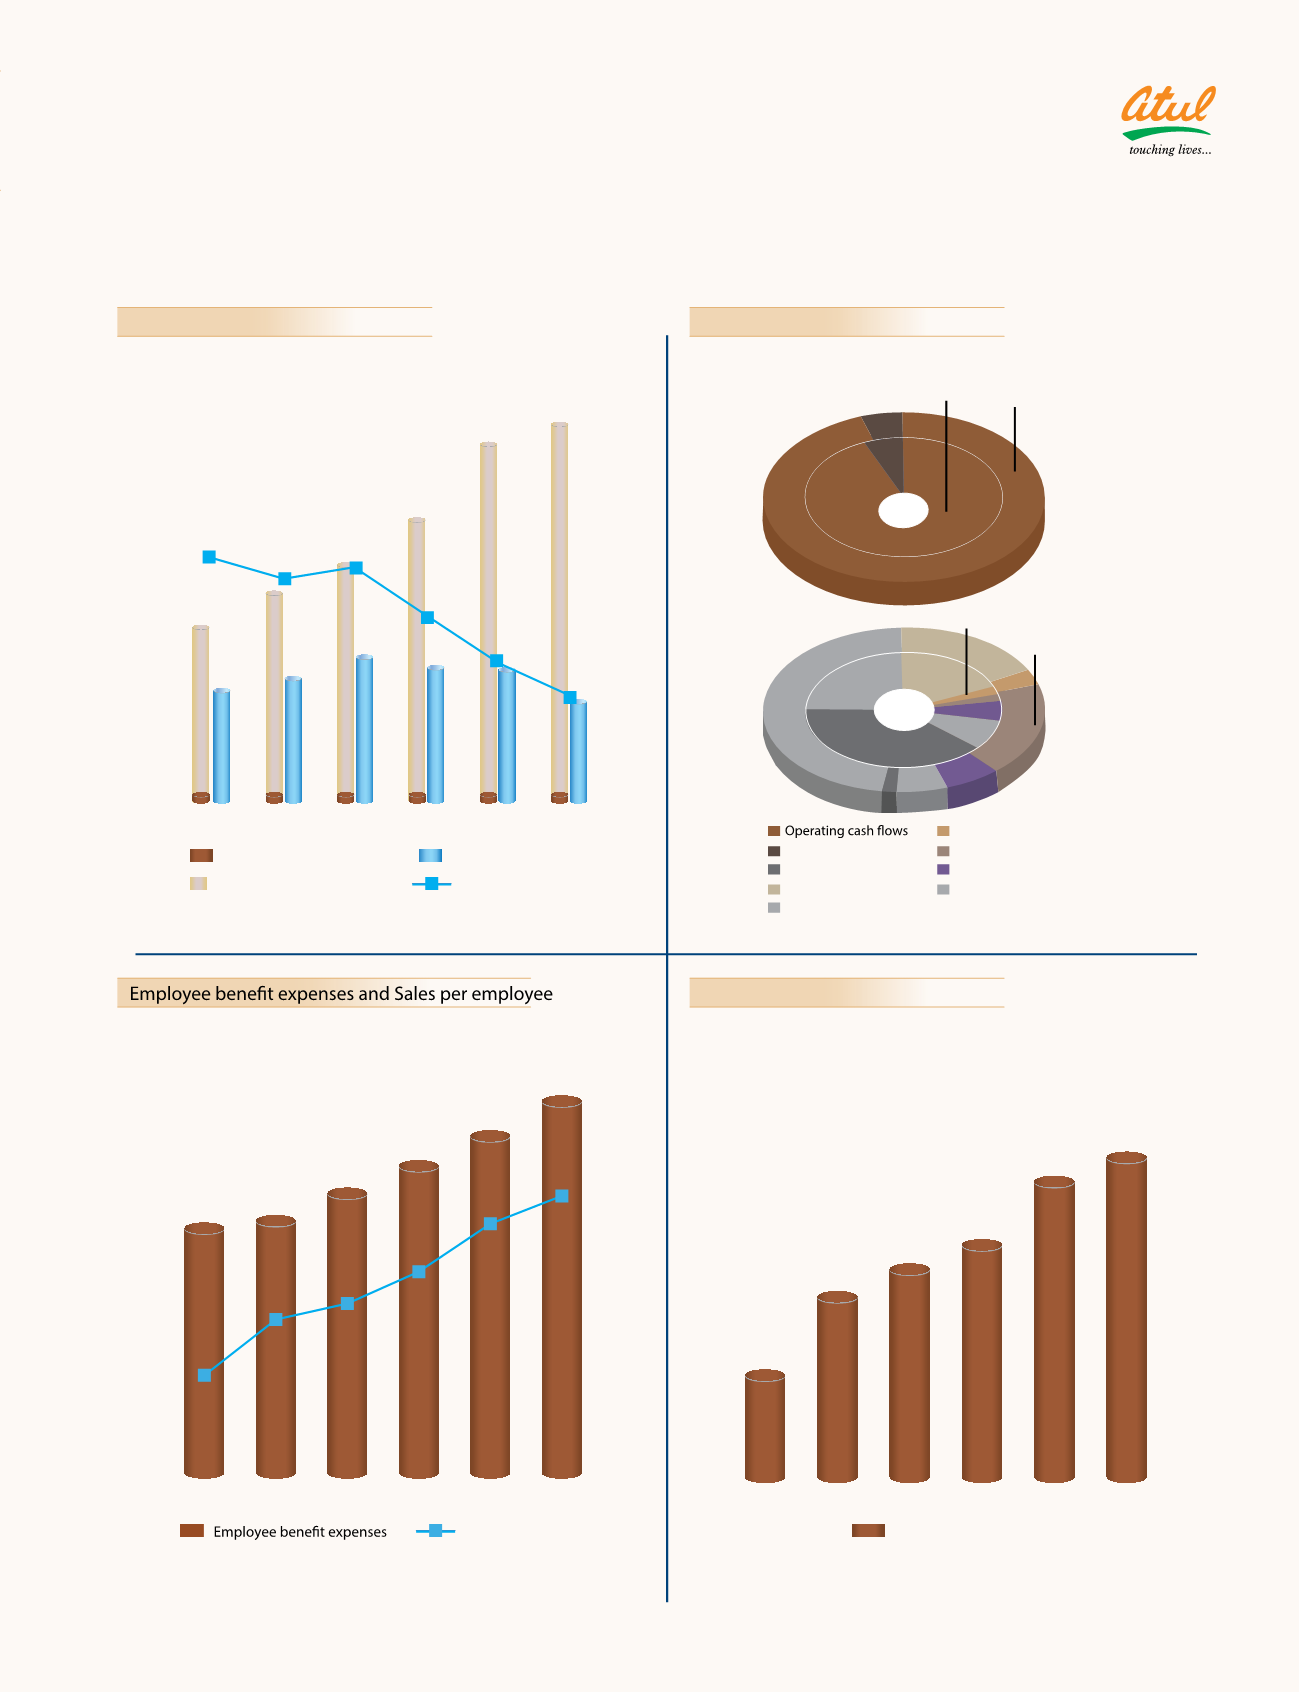
Borrowings
Share capital
2013-14 2014-15
Debt-Equity ratio
Reserves and surplus
30
30
537
454
295
0.61
0.60
0.58
0.47
0.37
0.28
327
382
355
351
281
612
726
911
986
30
30
30
30
360
192
12
75
26
24 (6)
72
147
72
97
8 8
21
31
12
2013-14 2014-15
2014-15
24
383
Sources
2013-14
Working capital changes
Direct taxes
Fixed asstes
Investments in group companies
Borrowings
Dividend and tax thereon
Interest
Other sources
Utilisation
0
20
40
60
80
100
120
140
160
0.20
0.40
0.60
0.80
1.00
1.20
0.46
103
106
117
128
140
154
0.60
0.64
0.72
0.84
0.91
Sales per employee
2010-11
2009-10
2011-12 2012-13 2013-14 2014-15
0
50
100
150
200
250
300
350
167
99
191
212
267
288
2010-11
2009-10
2011-12
Payment to the exchequer
2012-13 2013-14 2014-15
Debt-Equity
Sources and Utilisation of cash
Payment to the exchequer
17