


 176 / 236

Atul Ltd | Annual Report 2016-17
(
`
cr)
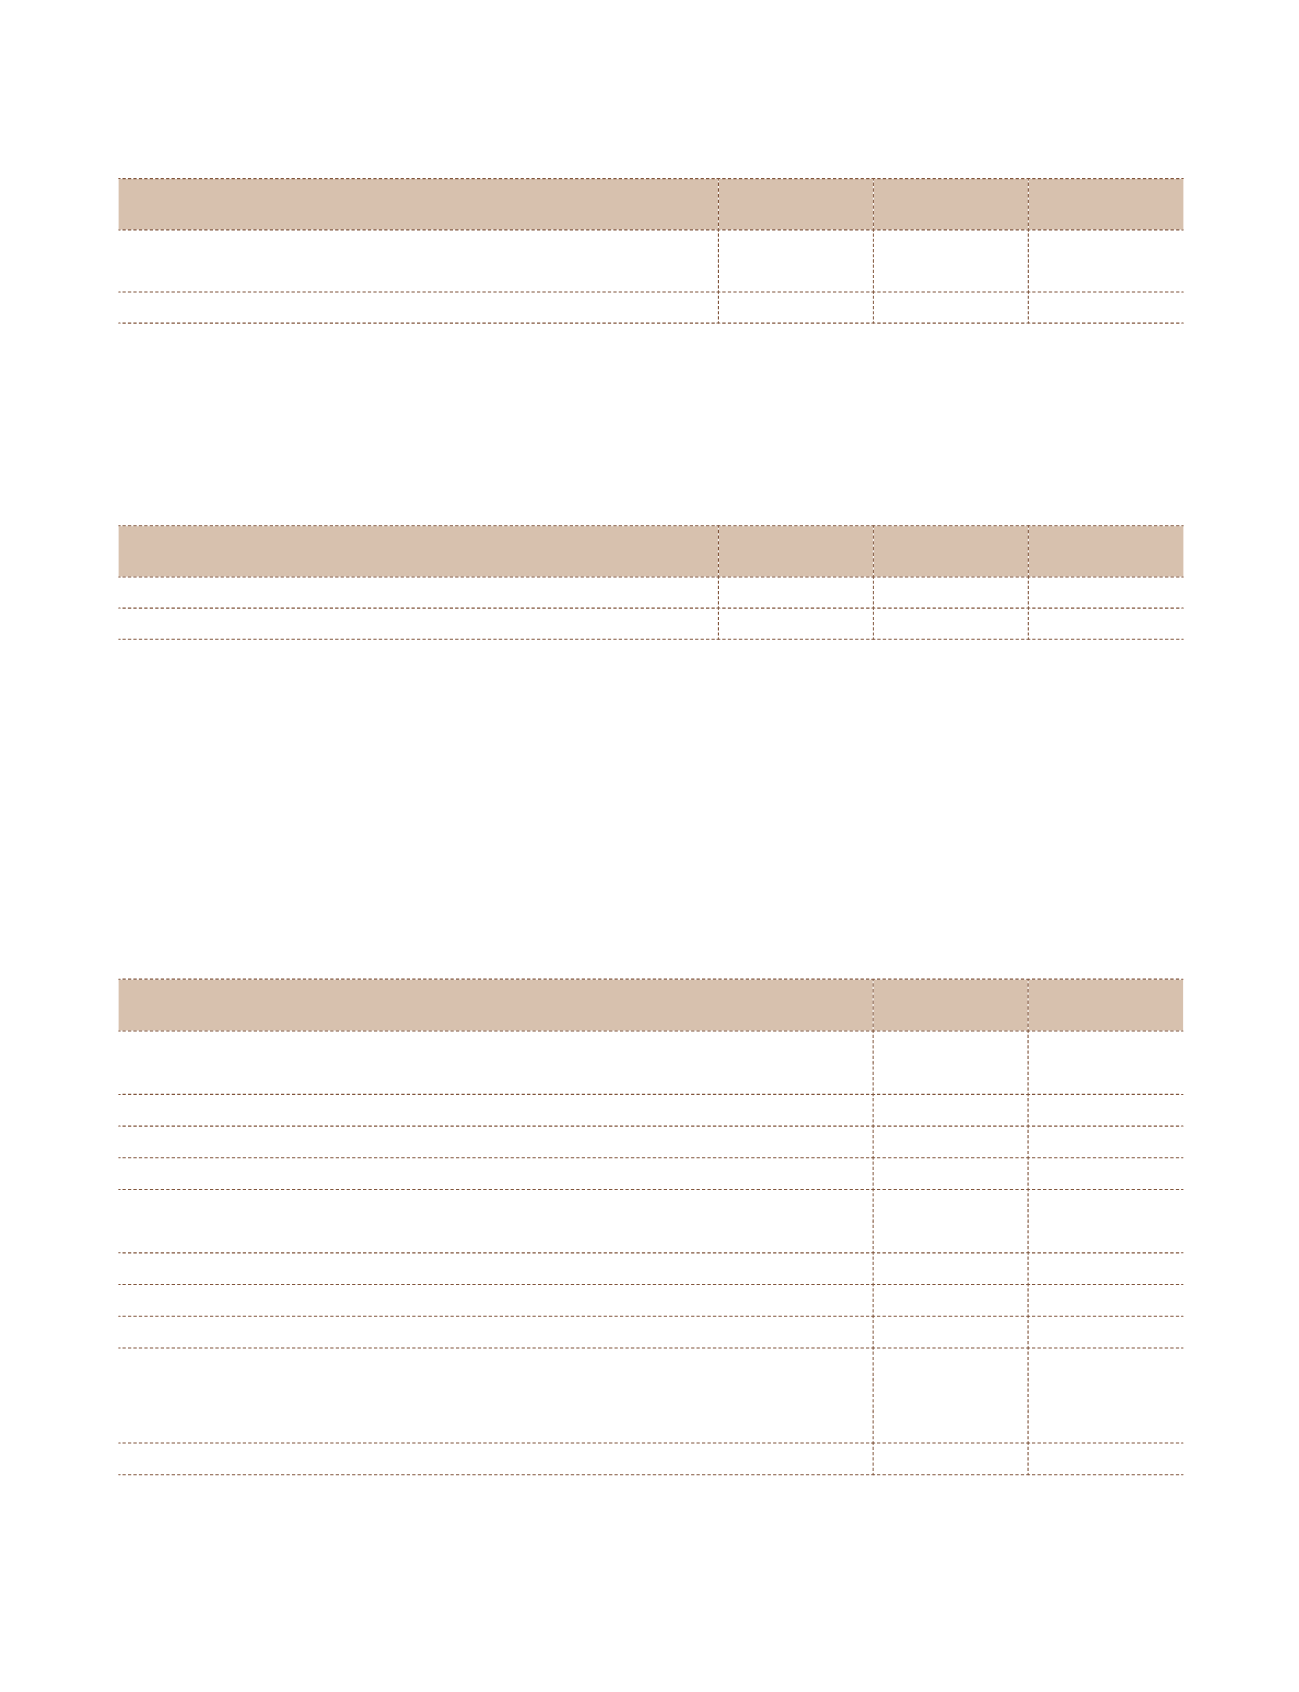
Note 3 Investment properties
As at
March 31, 2017
As at
March 31, 2016
As at
April 01, 2015
Land – freehold
Opening gross carrying amount | deemed cost
3.22
3.22
3.22
Net carrying amount
3.22
3.22
3.22
a) Amount recognised in profit or loss for investment properties
The Group has classified parcels of freehold land held for a currently undeterminable future use as investment properties.
There are no amounts pertaining to these investment properties recognised in the Consolidated Statement of Profit and
Loss, since the Group does not receive any rental income, incur any depreciation or other operating expenses.
b) The Company does not have any contractual obligations to purchase, construct or develop for maintenance or
enhancements of investment property.
c) Fair value
(
`
cr)
Particulars
As at
March 31, 2017
As at
March 31, 2016
As at
April 01, 2015
Investment properties
134.00
145.00
130.00
134.00
145.00
130.00
Estimation of fair value
The Group obtains independent valuations for its investment properties at least annually. The best evidence of fair value
is current prices in an active market for similar properties. Where such information is not available, the Group considers
information from a variety of sources including:
i)
Current prices in an active market for investment properties of different nature or recent prices of similar properties in less
active markets, adjusted to reflect those differences;
ii) Discounted cash flow projections based on reliable estimates of future cash flows;
iii) Capitalised income projections based upon an estimated net market income from investment properties and a
capitalisation rate derived from an analysis of market evidence.
The fair values of investment properties have been determined by reputed third party Independent Valuers. The main inputs
used are the rental growth rates, expected vacancy rates, terminal yields and discount rates based on comparable transactions
and industry data. All resulting fair value estimates for investment properties are included in level 3.
(
`
cr)
Note 4 (a) Intangible assets
Computer
software
Goodwill
Gross carrying amount
Deemed cost as at April 01, 2015
0.22
–
As at March 31, 2016
0.22
–
Acquisition of subsidiary company (refer Note 29.17)
–
23.75
As at March 31, 2017
0.22
23.75
Amortisation
Amortisation charged for the year
0.10
–
Up to March 31, 2016
0.10
–
Amortisation charged for the year
0.10
–
Up to March 31, 2017
0.20
–
Net carrying amount
As at April 01, 2015
0.22
–
As at March 31, 2016
0.12
–
As at March 31, 2017
0.02
23.75
Significant estimate - Impairment of Goodwill
For the purpose of impairment testing, Goodwill is allocated to a cash generating unit, representing the lowest level within the
Group at which Goodwill is monitored for internal Management purposes and which is not higher than the operating segment
of the Group. The Goodwill of
`
23.75 cr pertains to the acquisition of Amal Ltd. The recoverable amount of the cash generating
Notes
to the Consolidated Financial Statements