


 19 / 148

17
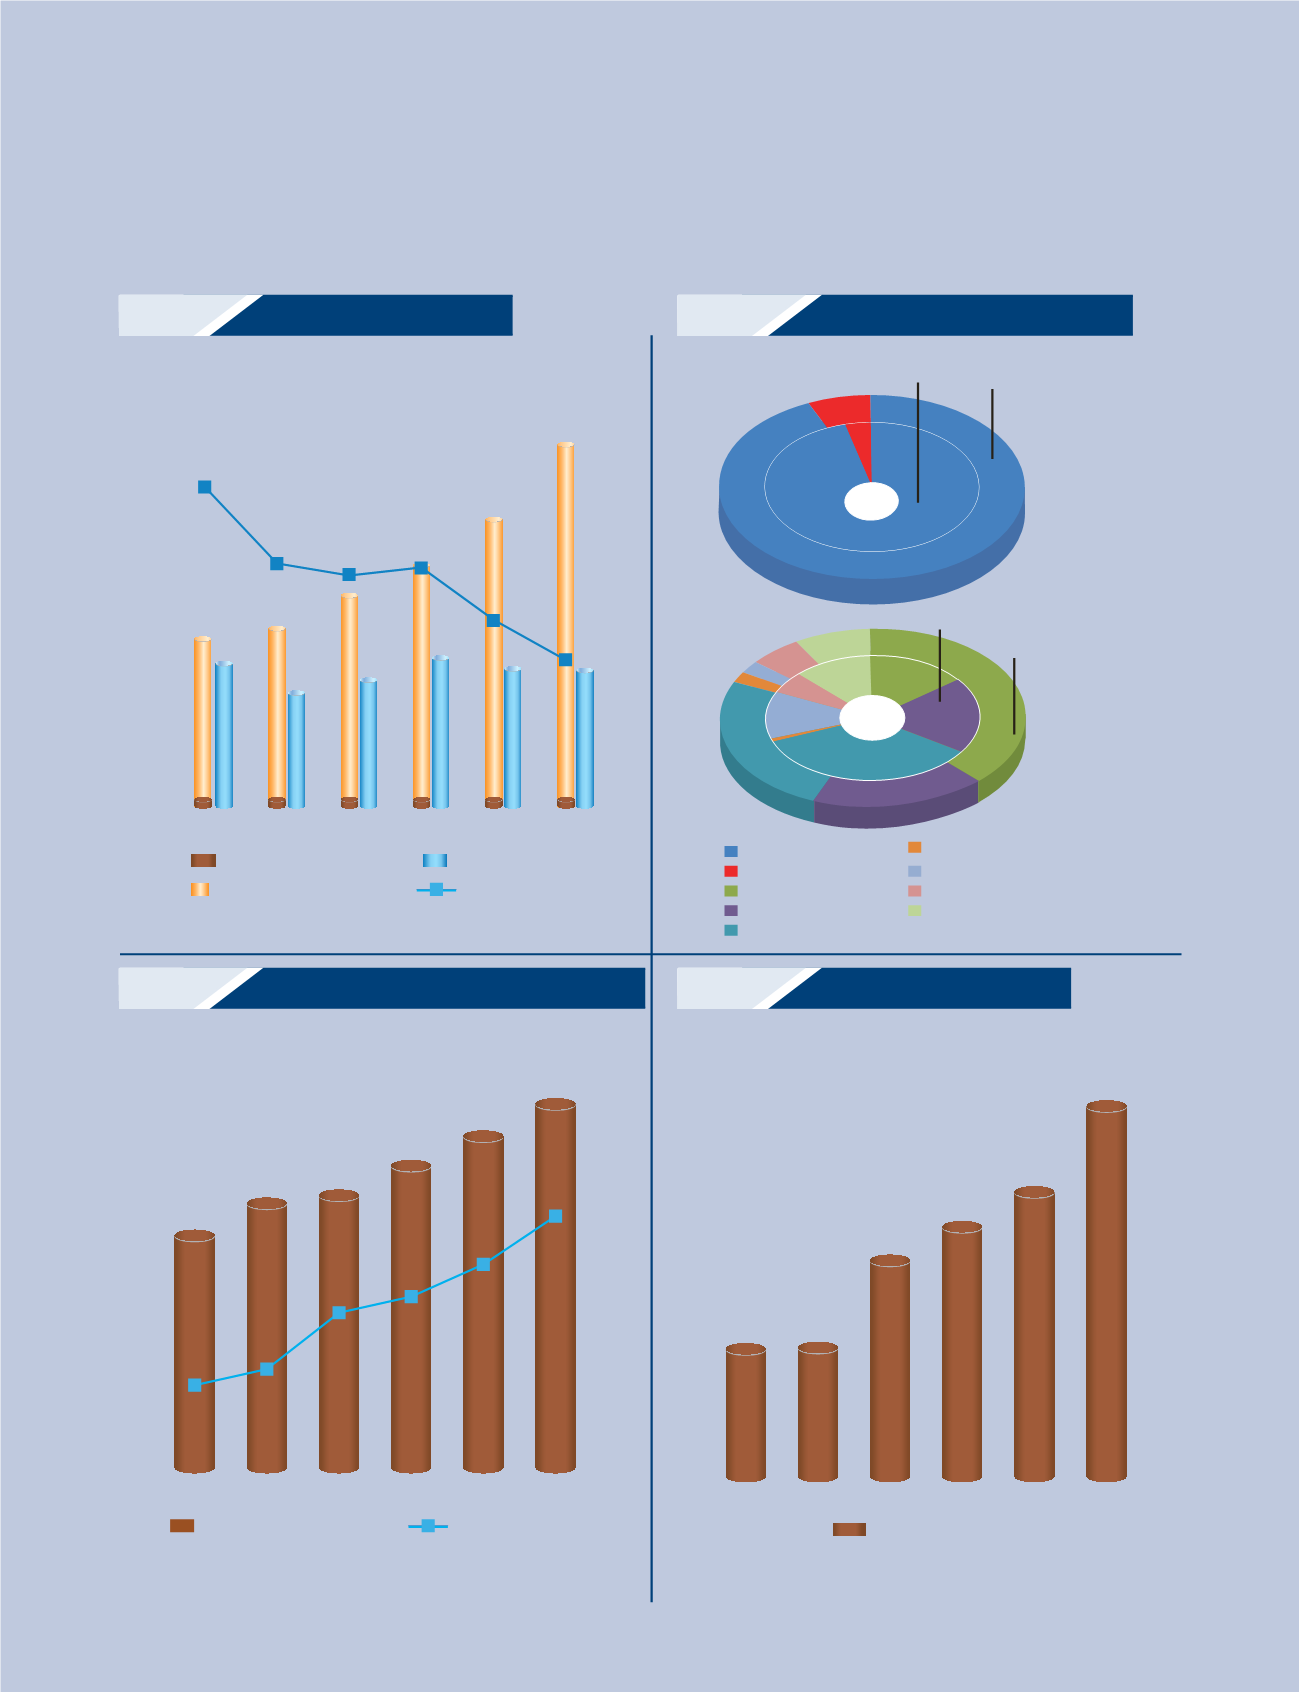
Debt-Equity
Employee Emoluments and Sales per Employee
Sources and Utilisation of Cash
Payment to Exchequer
`
cr
`
cr
`
cr
`
cr
0
100
200
300
400
500
600
700
800
900
1,000
0.0
0.2
0.4
0.6
0.8
1.0
2009-10
2008-09
2010-11 2011-12
Borrowings
Share capital
2012-13 2013-14
Debt-equity ratio
Reserves and surplus
30
30
455
429
368
0.61
0.80
0.58
0.60
0.47
0.37
295
327
382
355
351
537
612
726
912
30
30
30
30
260
147
72
98
8 8
21
31
41
53
94
2
33
15 32
25
2012-13 2013-14
2013-14
10
360
Sources
2012-13
Operating cash ows
Working capital changes
Direct taxes
Fixed asstes
Investments in group companies
Borrowings
Dividend and tax thereon
Interest
Other sources
Utilisation
0
30
60
90
120
150
0.2
0.4
0.6
0.8
1.0
1.2
0.46
0.42
103
91
106
117
128
140
0.60
0.64
0.72
0.84
Employee emoluments
Sales per employee
2009-10
2008-09
2010-11 2011-12 2012-13 2013-14
0
50
100
150
200
250
300
105
104
170
195
221
285
2009-10
2008-09
2010-11
Payment to exchequer
2011-12 2012-13 2013-14