


 18 / 148

Atul Ltd | Annual Report 2013-14
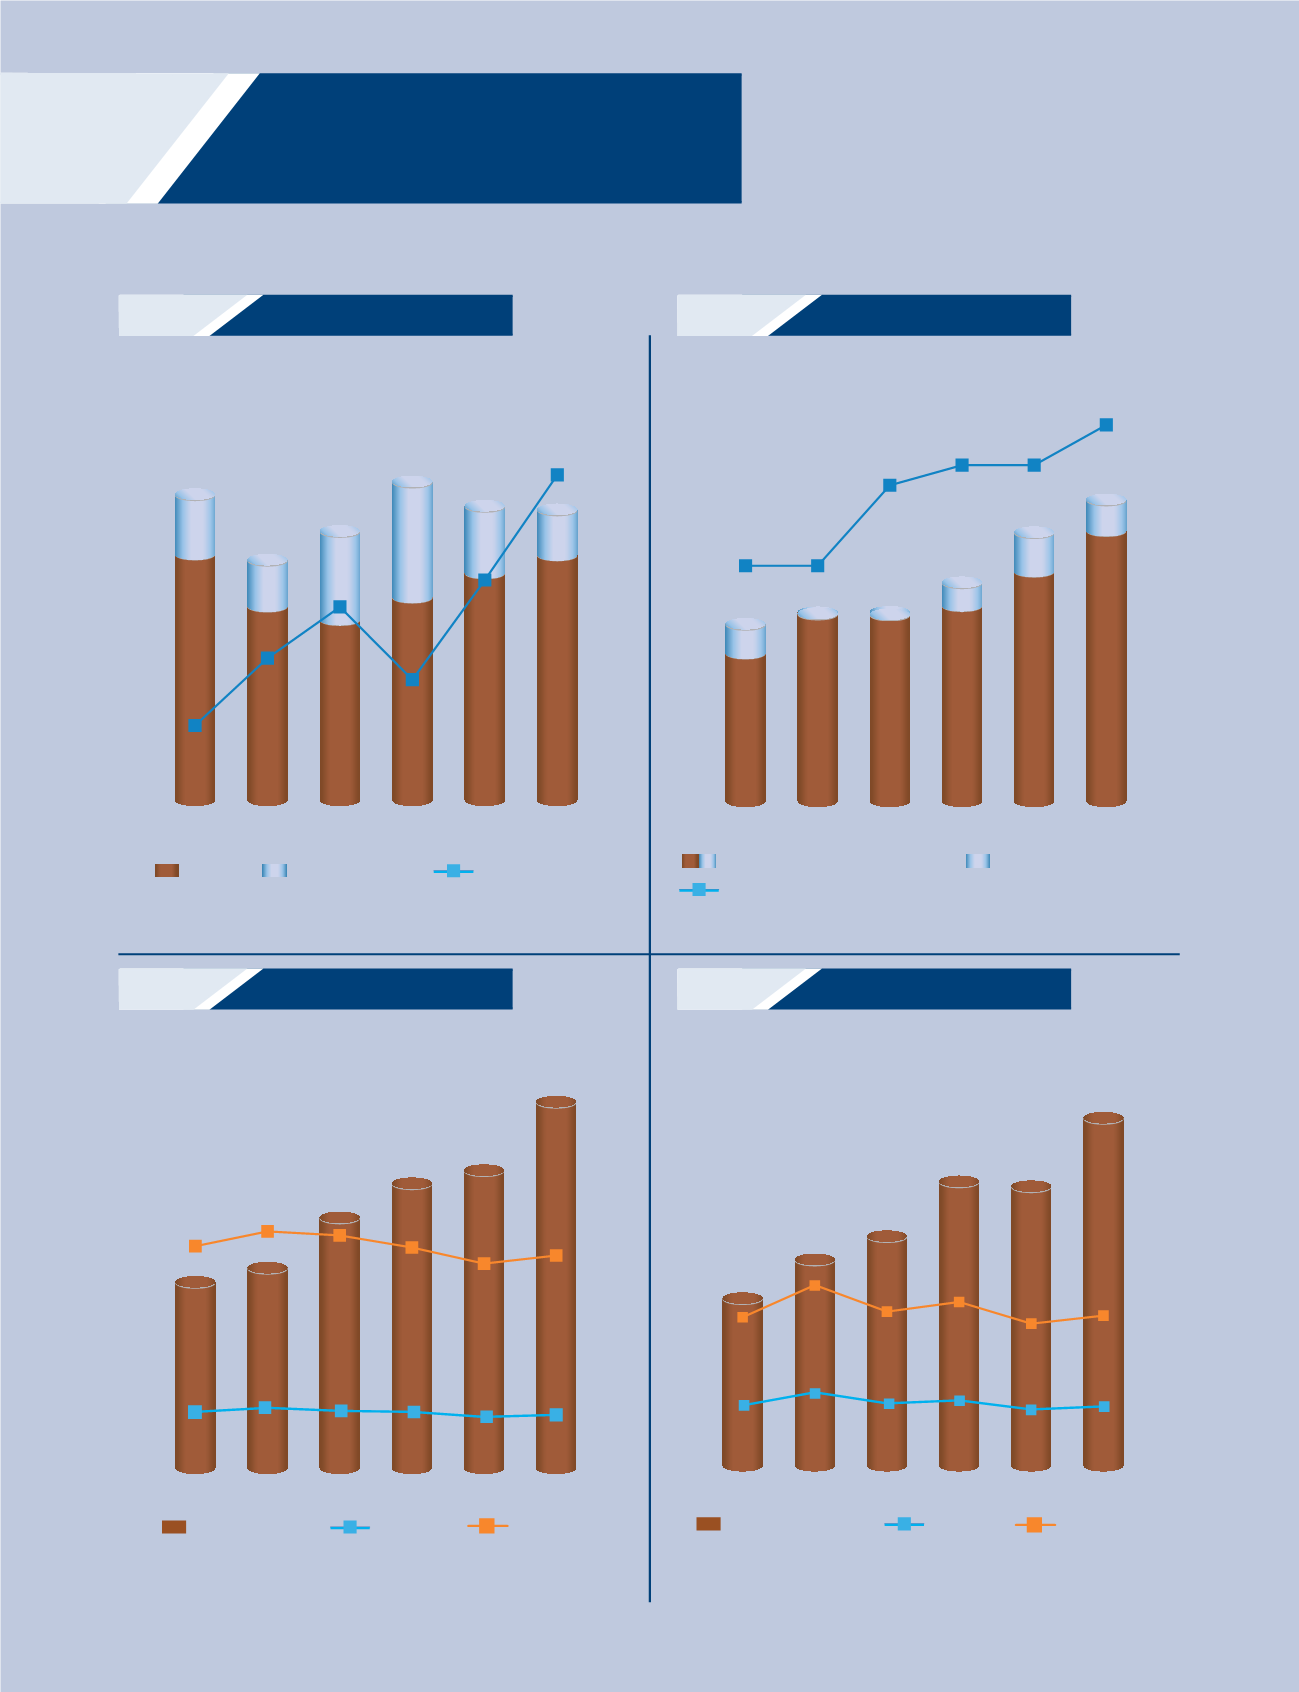
Financial Charts
Borrowings
Inventories
Fixed Assets
Trade Receivables
`
cr
%
`
cr
%
0
50
100
150
200
250
300
350
400
450
0
3
6
9
12
15
2009-10
2008-09
230
288
5.5
3.0
4.7
12.3
215
240
267
287
2010-11 2011-12
Foreign currency
Interest coverage ratio
2012-13 2013-14
Rupee
65
80
112
142
88
64
7.5
8.4
`
cr
`
cr
500
800
1,100
1,400
0.0
0.2
0.4
0.6
0.8
1.0
1.2
1.4
1.6
1.8
2.0
949
859
1,229
974
951
1.2
1.2
1.6
1.7
1.7
1.9
950
965
1,042
1,133
Fixed assets turnover ratio
Additions during the year
Gross block*
* Excluding capital work-in-progress
25
92
1,044
79
1,156
114
96
972
22
2009-10
2008-09
2010-11 2011-12 2012-13 2013-14
0
50
100
150
200
250
300
350
400
0
5
10
15
20
25
30
17.0%
18.1%
211
66
197
62
63
62
57
59
261
295
308
376
17.3%
16.9%
15.7% 16.3%
Inventories
NoDs
% to sales
2009-10
2008-09
2010-11 2011-12 2012-13 2013-14
0
50
100
150
200
250
300
350
400
450
500
0
10
20
30
40
50
271
223
79
66
68
71
62
65
300
368
362
447
19.9%
23.2%
19.2%
21.1%
18.4% 19.4%
Trade receivables
NoDs
% to sales
2009-10
2008-09
2010-11 2011-12 2012-13 2013-14