


 68 / 168

Atul Ltd | Annual Report 2014-15
7.11 Distribution of shareholding as on March 31, 2015
7.11.01 Shareholding-wise:
Holding
Shareholders
Shares
Numbers
% of total
Numbers
% of total
1 – 10
5,537
18.79
29,953
0.10
11 – 50
11,515
39.08
3,18,653
1.07
51 – 100
4,597
15.60
3,77,889
1.27
101 – 500
5,833
19.79
13,88,548
4.68
501 – 1,000
994
3.37
7,37,729
2.49
1,001 – 2,000
434
1.47
6,25,383
2.11
2,001 – 3,000
156
0.53
3,92,040
1.32
3,001 – 4,000
82
0.28
2,96,333
1.00
4,001 – 5,000
58
0.20
2,69,811
0.91
5,001 – 10,000
100
0.34
7,56,288
2.55
10,001 and above
161
0.55
2,44,69,106
82.49
Total
29,467
100.00
2,96,61,733
100.00
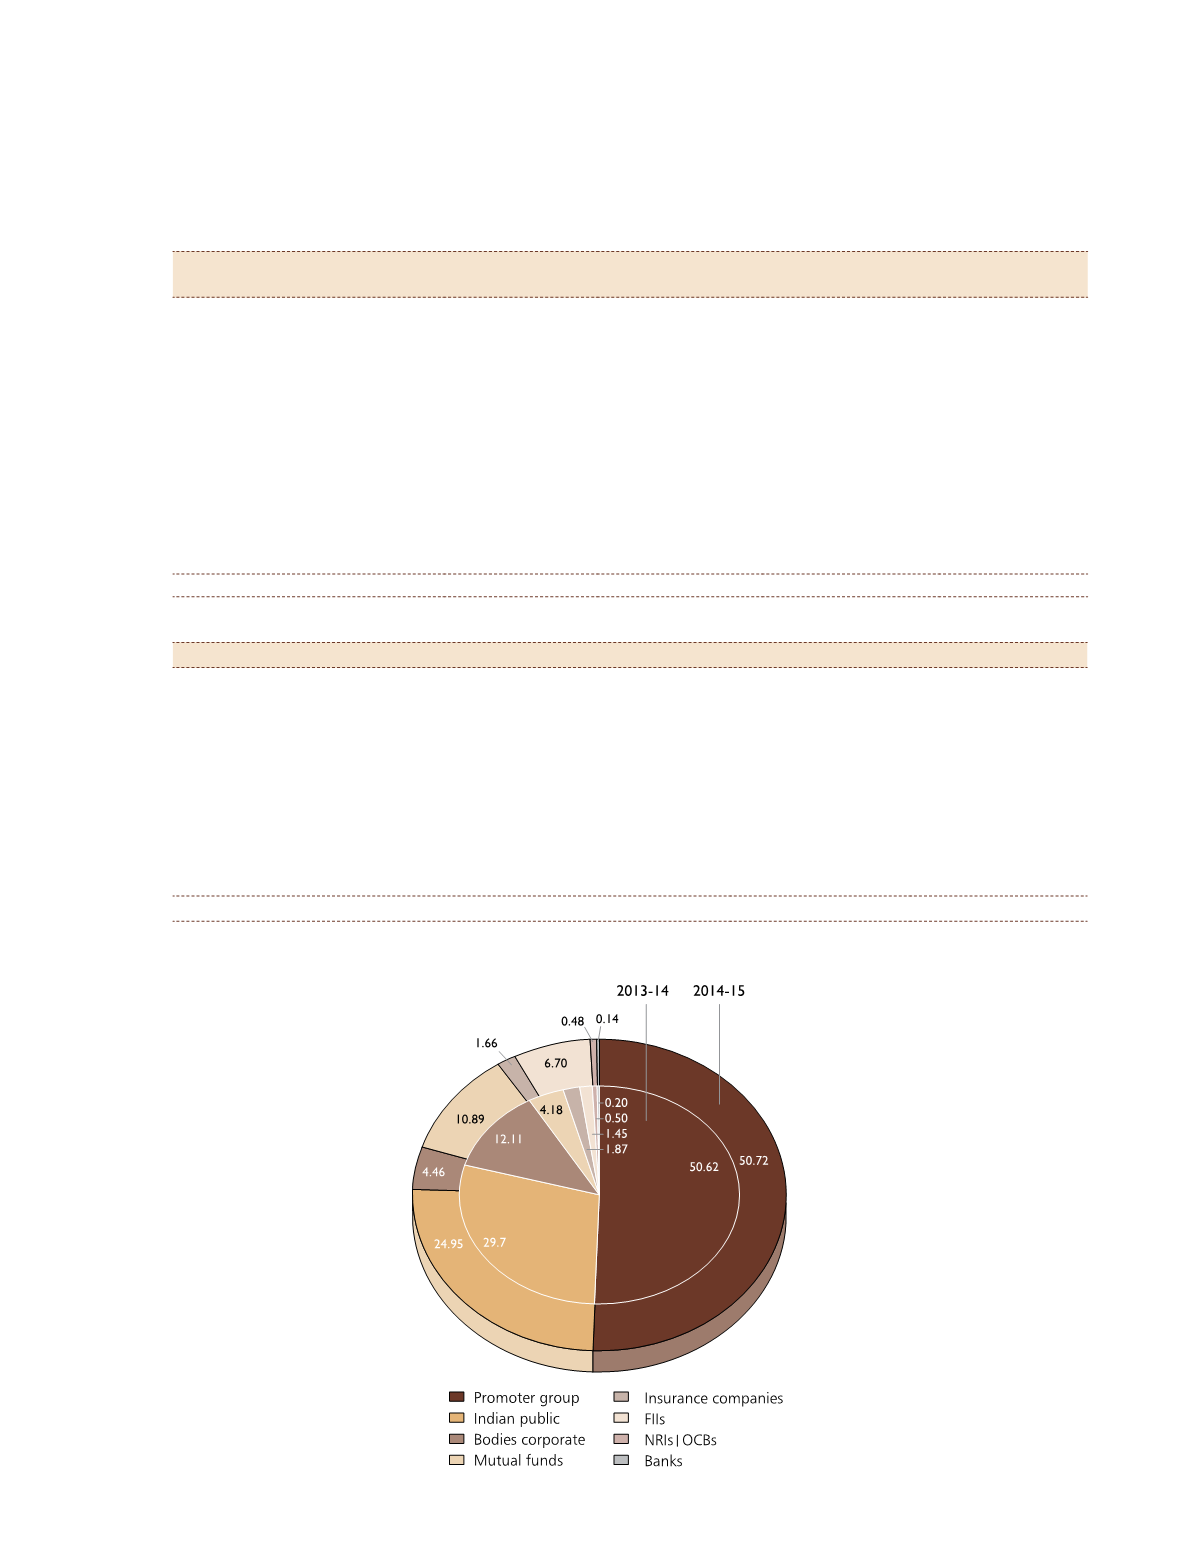
7.11.02 Category-wise:
Category
Shares (Numbers) Shareholding (%)
Promoter group
1,50,43,379
50.72
Indian public
74,01,382
24.95
Bodies corporate
13,19,919
4.46
Mutual funds
32,31,030
10.89
Insurance companies
4,93,094
1.66
Foreign institutional investors
19,86,618
6.70
Non-resident Indians | Overseas corporate bodies
1,44,180
0.48
Banks
41,795
0.14
State Government
336
0.00
Total
2,96,61,733
100.00%