


 18 / 172

Atul Ltd | Annual Report 2015-16
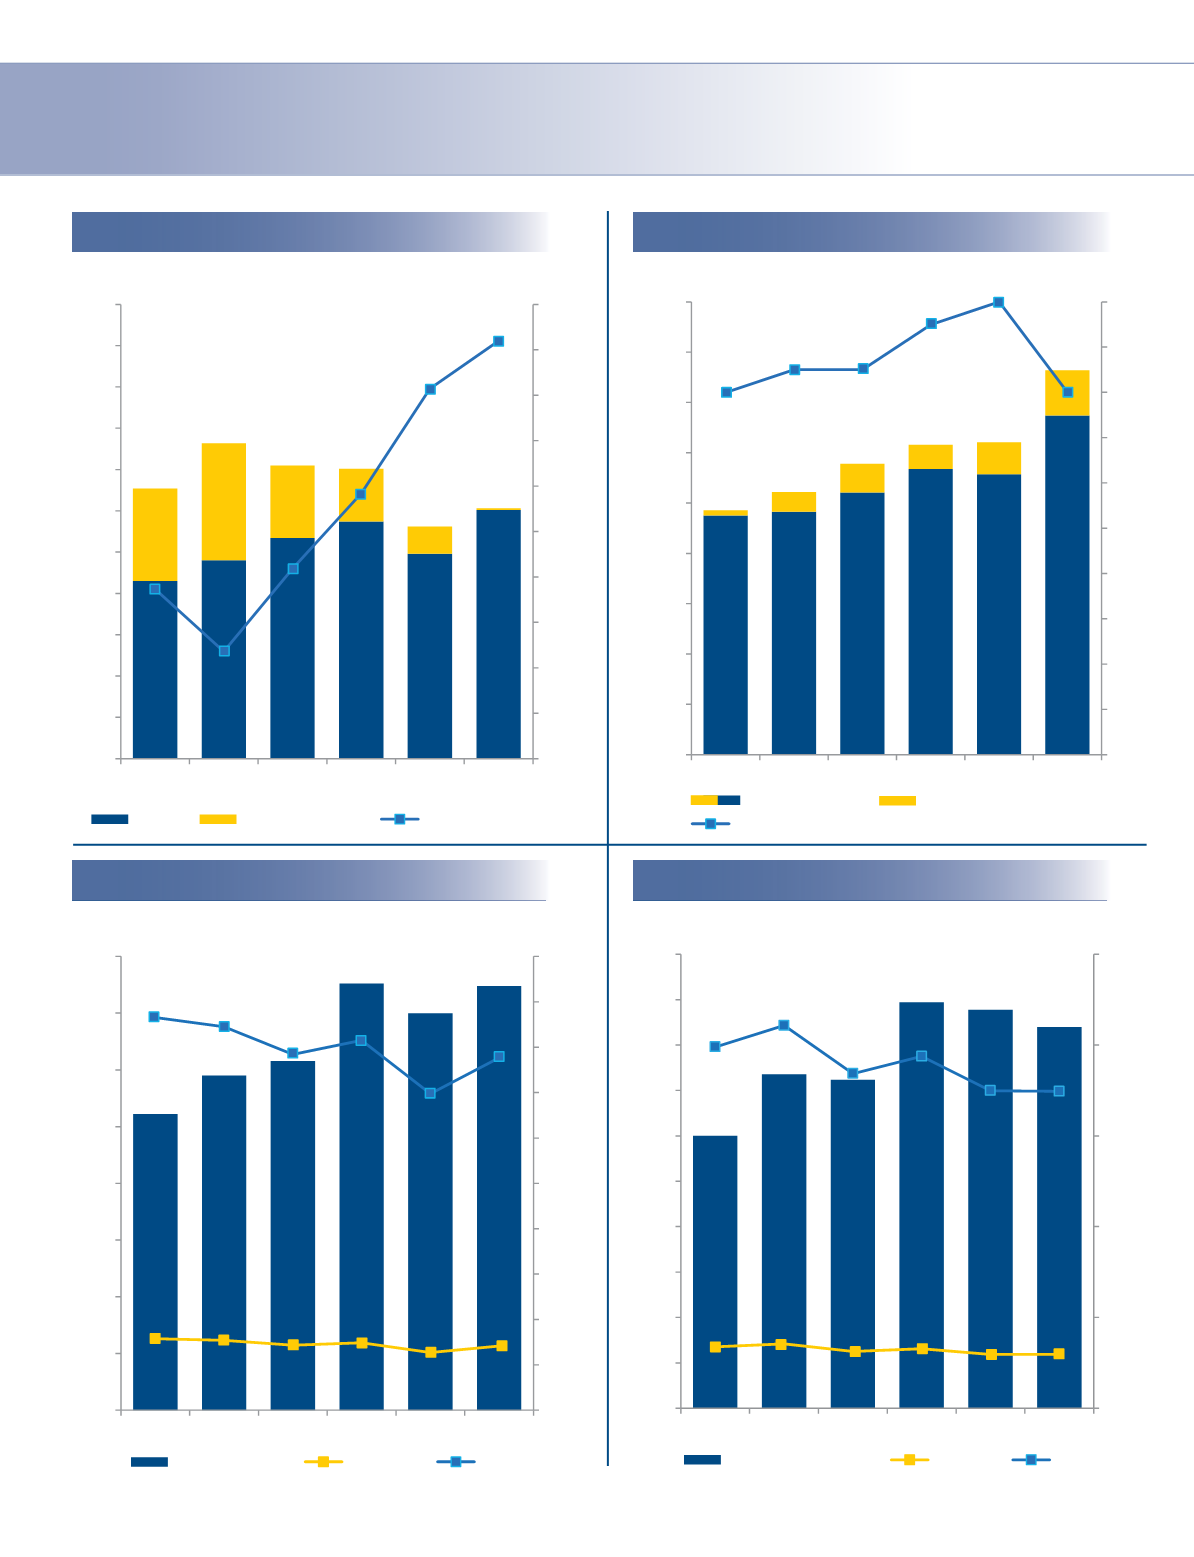
Financial charts
Inventories
Trade receivables
Borrowings
Fixed assets
215
240
267
287
248
301
112
142
88
64
33
2
7.5
4.7
8.4
11.7
16.3
18.4
0
2
4
6
8
10
12
14
16
18
20
0
50
100
150
200
250
300
350
400
450
500
550
2010-11 2011-12 2012-13 2013-14 2014-15 2015-16
Rupee
Foreign currency
Interest coverage raƟo
`
cr
950
965
1,042
1,136 1,116
1,228
22
79
114
96
125
300
972
1,044
1,156
1,232 1,241
1,528
1.6
1.7
1.7
1.9
2.0
1.6
0.0
0.2
0.4
0.6
0.8
1.0
1.2
1.4
1.6
1.8
2.0
0
200
400
600
800
1,000
1,200
1,400
1,600
1,800
2010-11 2011-12 2012-13 2013-14 2014-15 2015-16
AddiƟons during the year
Fixed assets turnover raƟo
`
cr
`
cr
261
295
308
376
350
374
63
62
57
59
51
57
17.3%
16.9%
15.7%
16.3%
13.9%
15.5%
0
2
4
6
8
10
12
14
16
18
20
0
50
100
150
200
250
300
350
400
2010-11 2011-12 2012-13 2013-14 2014-15
Inventories
NoDs
% to sales
`
cr
%
300
368
362
447
439
420
68
71
62
65
59
59
19.9%
21.1%
18.4%
19.4%
17.5%
17.4%
0
5
10
15
20
25
0
50
100
150
200
250
300
350
400
450
500
2010-11 2011-12 2012-13 2013-14 2014-15
Trade receivables
NoDs
% to sales
2015-16
2015-16
Gross block
%