


 19 / 172

17
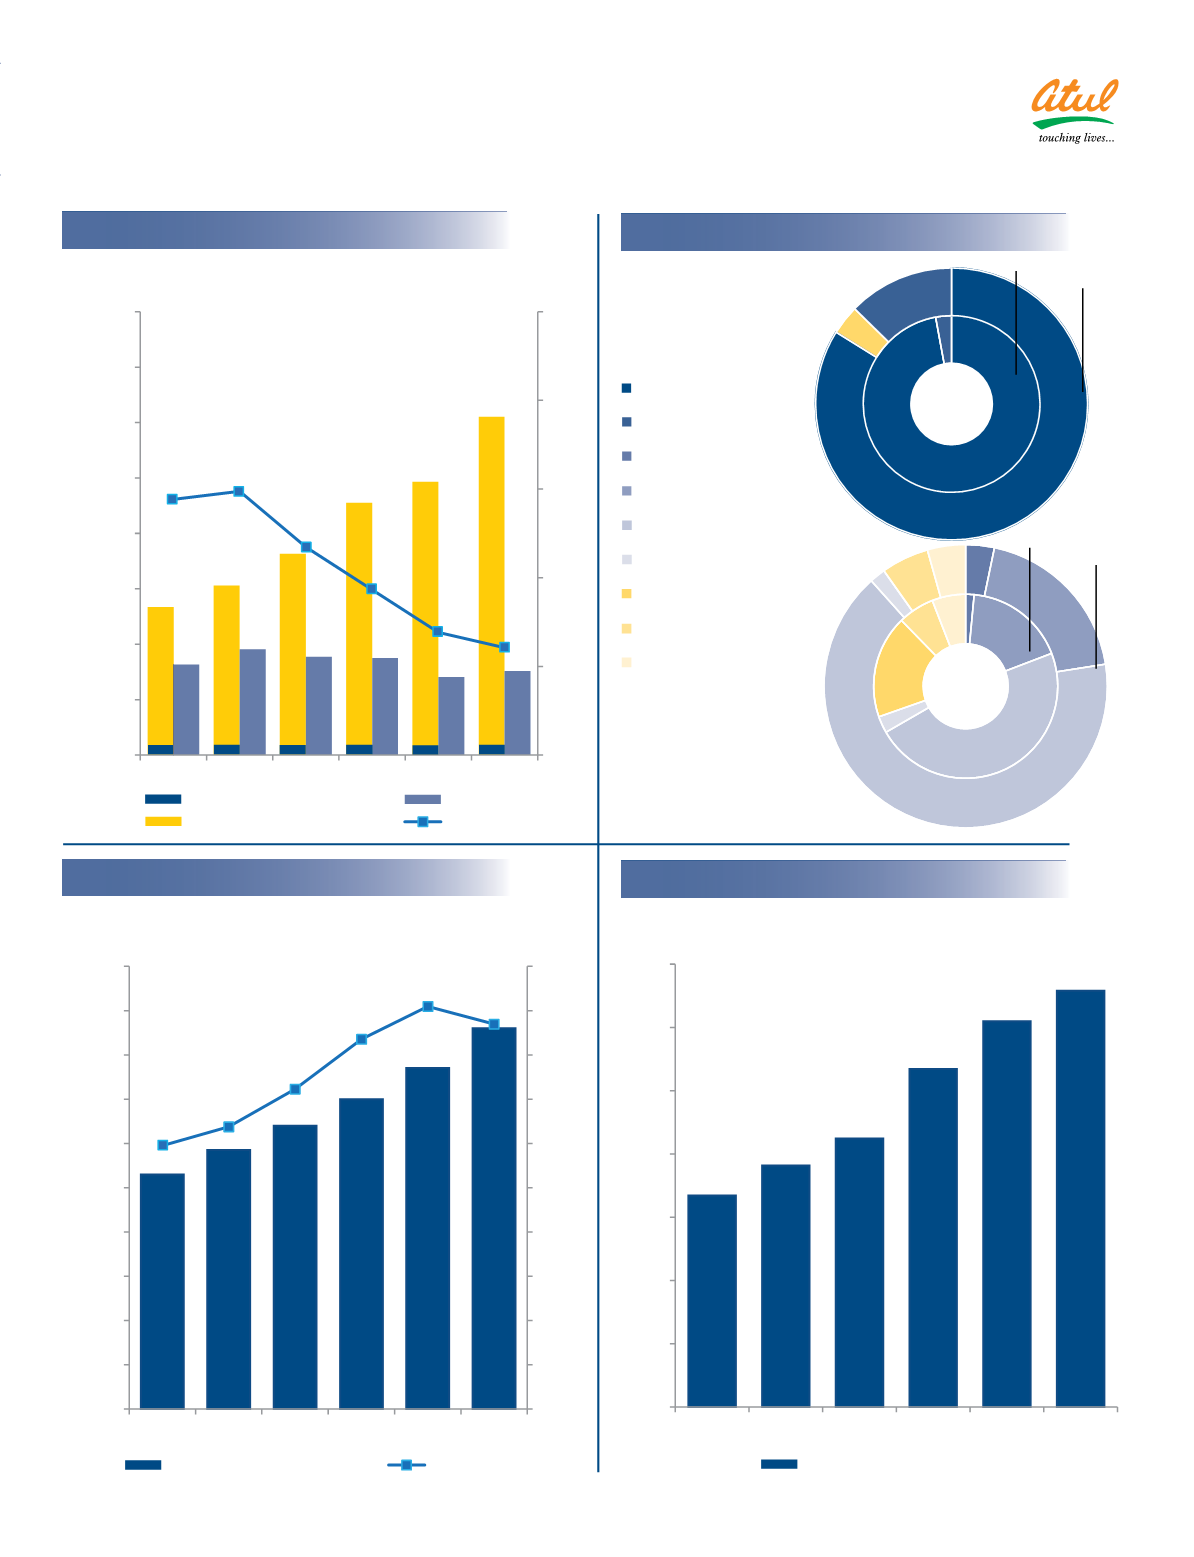
Debt-equity
Sources and Utilisation of cash
Employee benefit expenses and Sales per employee
Payment to the exchequer
537
612
726
911
986
1,221
327
382
355
351
281
303
0.58
0.60
0.47
0.37
0.28
0.24
0.00
0.20
0.40
0.60
0.80
1.00
0
200
400
600
800
1,000
1,200
1,400
1,600
2010-11 2011-12 2012-13 2013-14 2014-15 2015-16
Reserves and surplus
Borrowings
Debt-Equity raƟo
(6)
72
193
12
73
26
24
18
106
363
10 30 24
OperaƟng cash flows
Other sources
Working capital changes
Direct taxes
Fixed assets
Investment in group companies
Borrowings
Dividend and tax thereon
Interest
`
cr
`
cr
`
cr
106
117
128
140
154
172
0.60
0.64
0.72
0.84
0.91
0.87
0.00
0.10
0.20
0.30
0.40
0.50
0.60
0.70
0.80
0.90
1.00
0
20
40
60
80
100
120
140
160
180
200
2010-11 2011-12 2012-13 2013-14 2014-15 2015-16
Employee benefit expenses
Sales per employee
`
cr
167
191
212
267
305
329
0
50
100
150
200
250
300
350
2010-11 2011-12 2012-13 2013-14 2014-15 2015-16
Payment to the exchequer
383
11
462
19
70
Sources
UƟlisaƟon
Share capital
30
30
30
30
30
30
2014-15
2015-16
2014-15
2015-16