


 16 / 172

Atul Ltd | Annual Report 2015-16
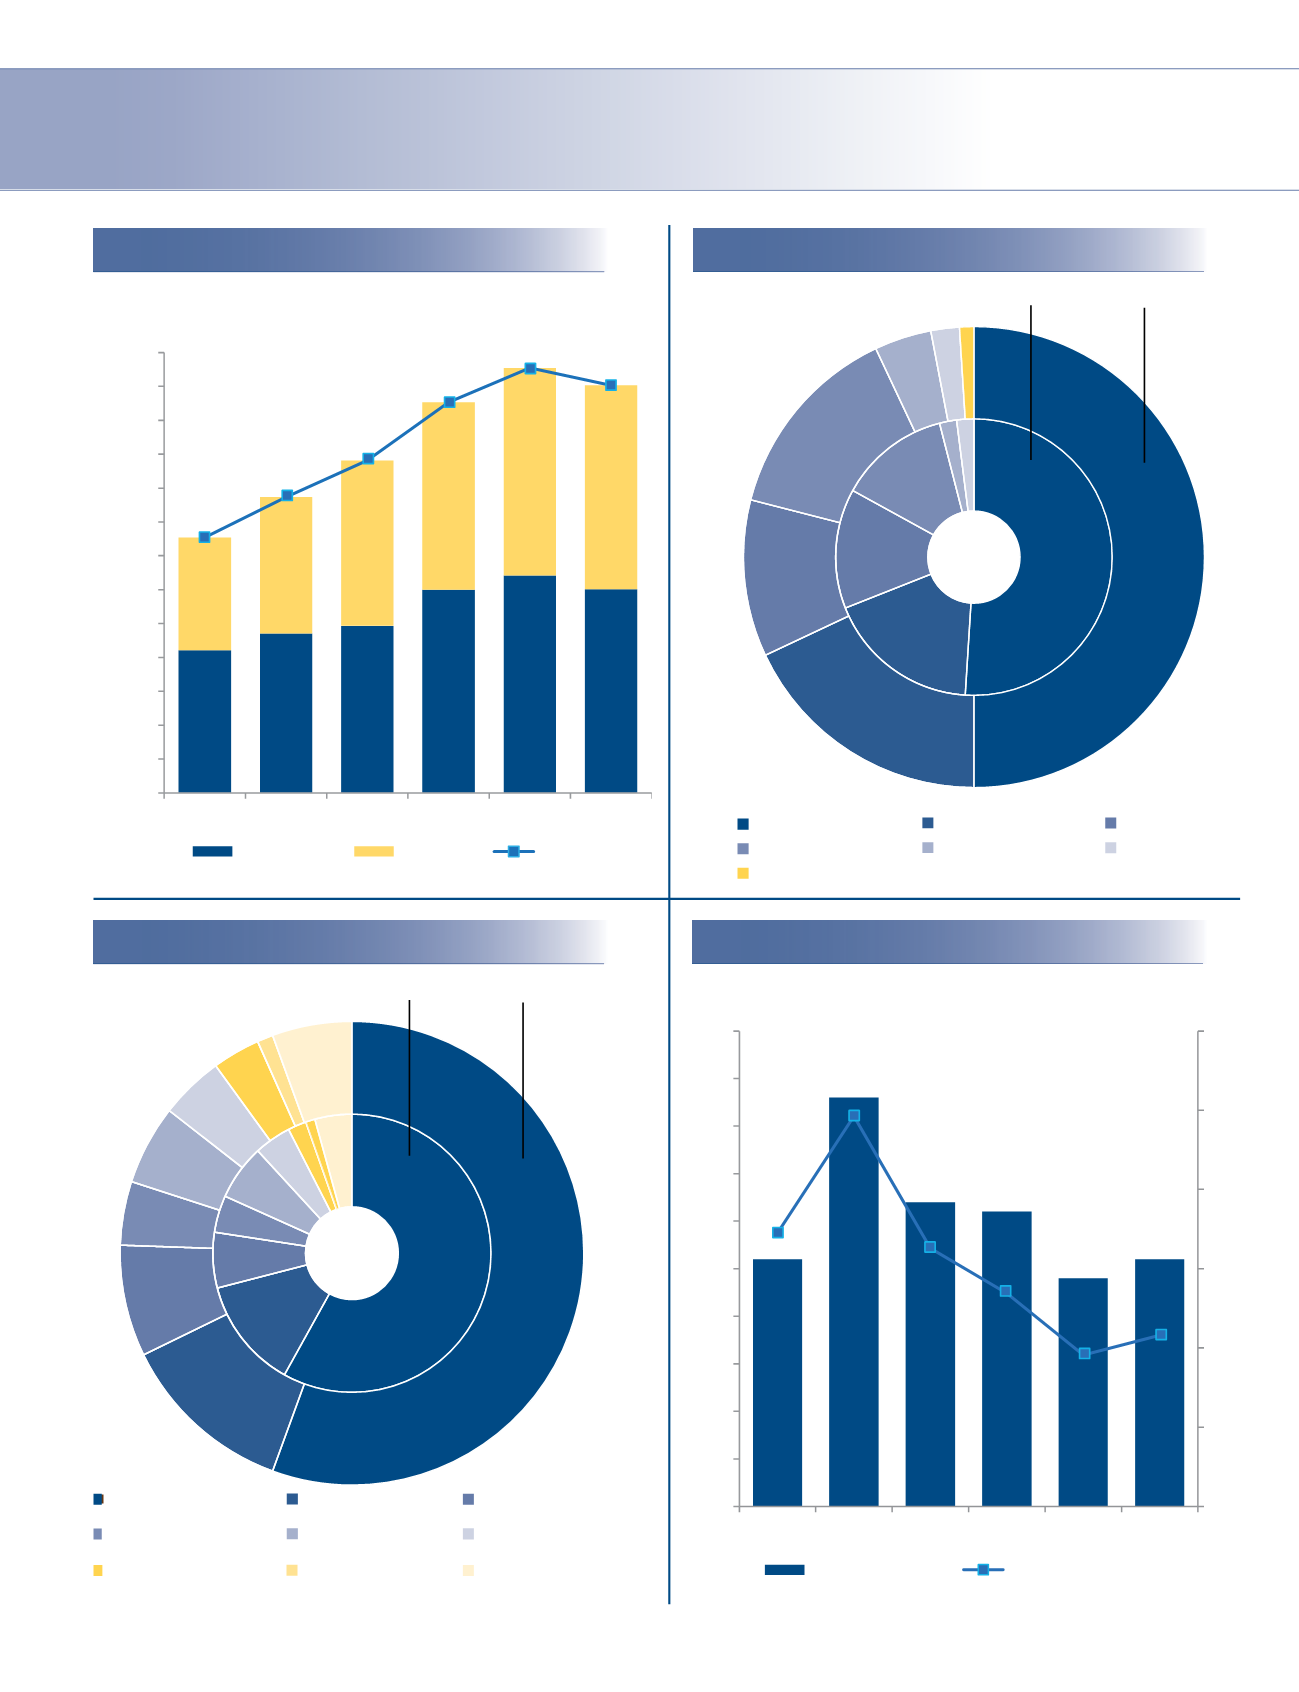
Financial charts
5 - year CAGR: 10%
Sales
Sales by geography
Expenses*
Finance costs
1,508
1,746
1,964
2,307
2,510
2,407
0
200
400
600
800
1,000
1,200
1,400
1,600
1,800
2,000
2,200
2,400
2,600
2010-11 2011-12 2012-13 2013-14 2014-15 2015-16
DomesƟc
Export
Growth
`
cr
16%
12%
17%
9%
(4%)
44%
46%
50%
48%
49%
50%
56%
54%
50%
52%
51%
50%
54
12
6
4
6
4 2
1
4
50
11
7
4
5
4
3
1 5
Raw materials
Power, fuel and water Employees
Selling and distribuƟons
Others
Repairs and maintenance
DepreciaƟon
Finance costs
Tax
2014-15
2015-16
*as % of operaƟng revenue
26
43
32
31
24
26
1.7%
2.5%
1.6%
1.3%
1.0%
1.1%
0.0
0.5
1.0
1.5
2.0
2.5
3.0
0
5
10
15
20
25
30
35
40
45
50
2010-11 2011-12 2012-13 2013-14 2014-15 2015-16
Finance costs
Finance costs as % to sales
`
cr
%
51%
18%
14%
13%
2%
2%
0%
50%
18%
11%
14%
4% 2%
1%
India
Asia (excluding India)
Europe
North America
South America
Africa
Australia
%
2014-15
2015-16