


 48 / 140

Atul Ltd | Annual Report 2011-12
7.11 Distribution of Shareholding as on March 31, 2012
i) Shareholding wise:
Holding
Shareholders
Shares
Numbers
% of Total
Numbers
% of Total
1 – 10
11 – 50
51 – 100
101 – 500
501 – 1000
1001 – 2000
2001 – 3000
3001 – 4000
4001 – 5000
5001 – 10000
10001 and above
4,639
12,677
5,374
7,021
1,219
551
185
84
84
128
155
14.44
39.47
16.73
21.86
3.80
1.72
0.58
0.26
0.26
0.40
0.48
24,671
3,54,382
4,58,215
17,22,171
9,26,687
8,17,045
4,68,067
2,97,467
3,95,277
9,37,438
2,32,60,313
0.08
1.19
1.55
5.81
3.12
2.76
1.58
1.00
1.33
3.16
78.42
Total
32,117
100.00
2,96,61,733
100.00
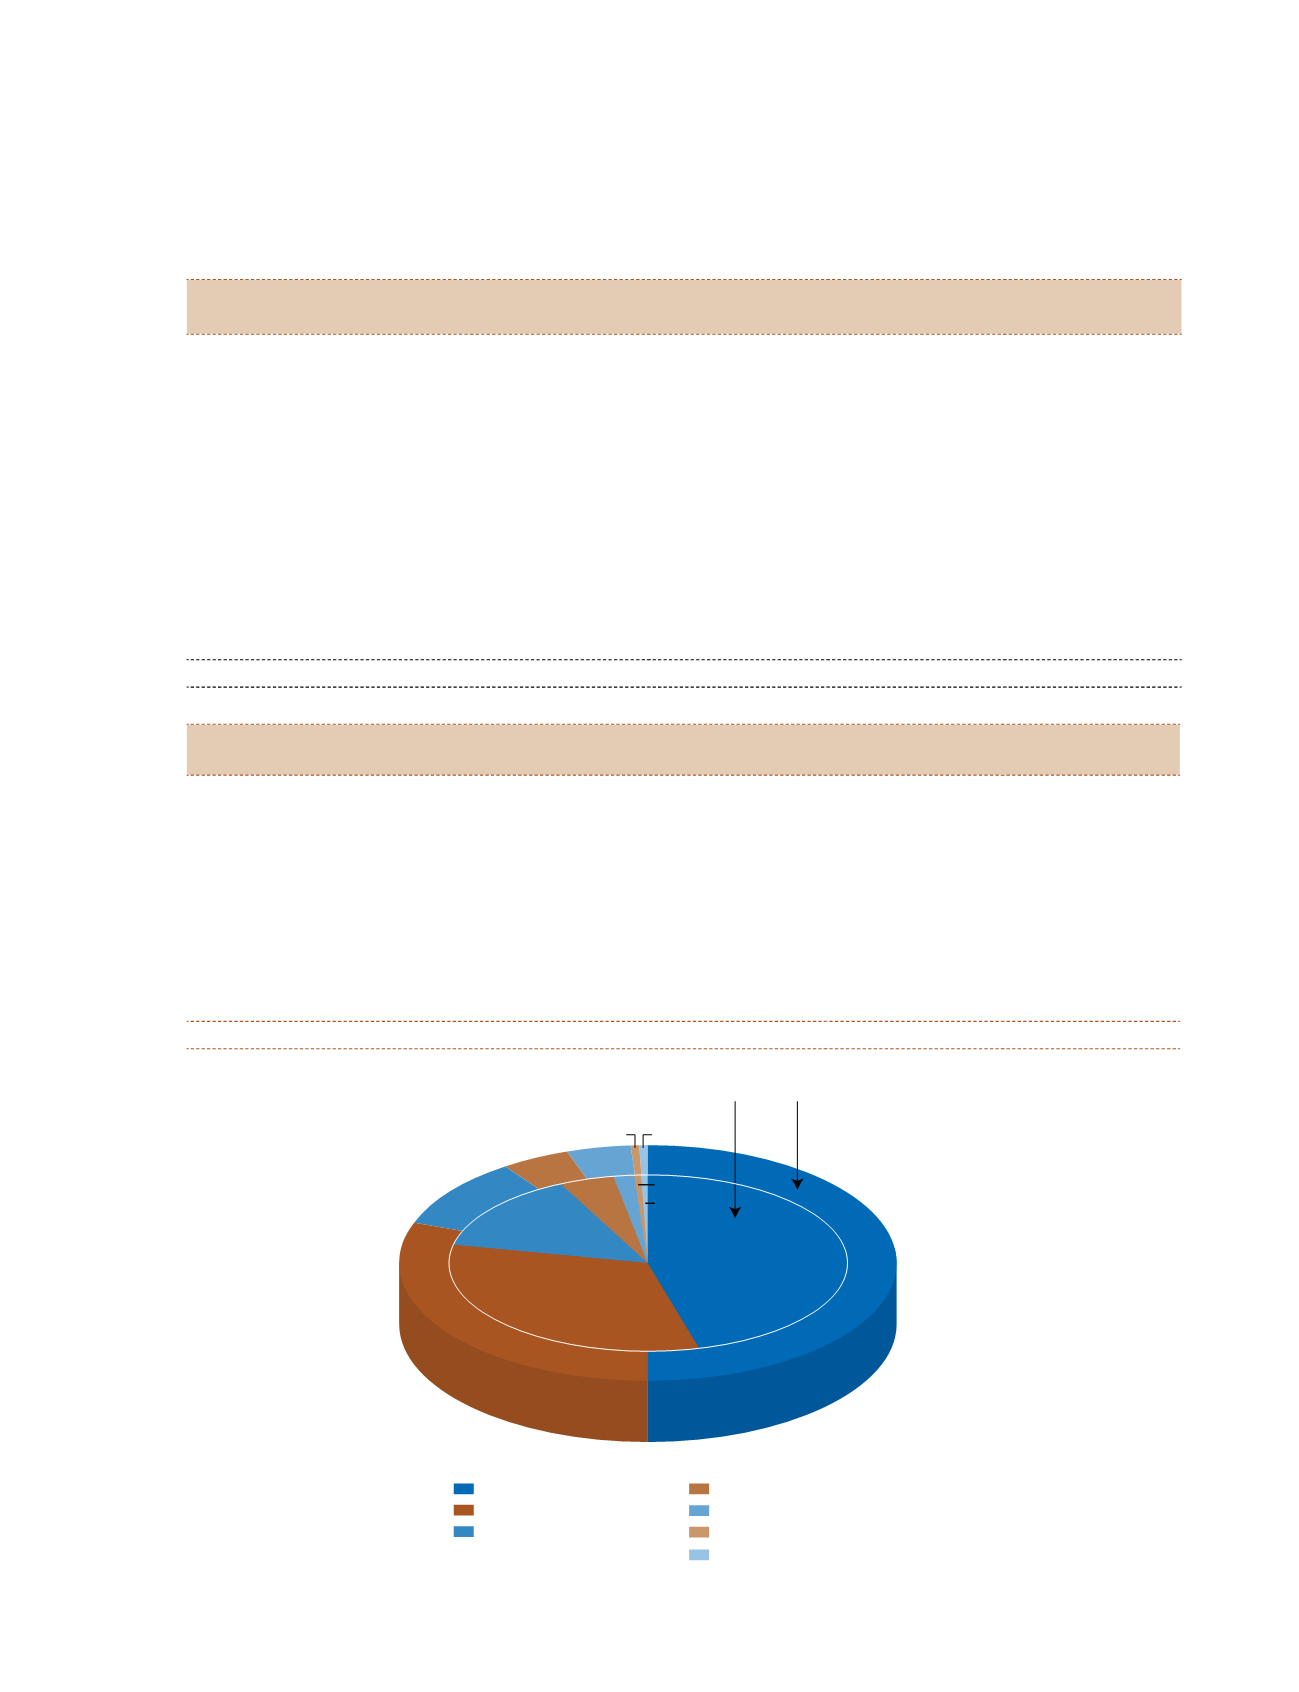
ii) Category wise
Category
Shares
(Numbers)
Shareholding (%)
Promoter group
1,48,61,718
50.10
Mutual Funds
12,62,176
4.26
Banks
1,00,238
0.34
Insurance Companies
13,18,773
4.45
Foreign Institutional Investors
900
0.00
Corporate Bodies
28,89,021
9.74
Non Resident Indians | Overseas Corporate Bodies
1,56,229
0.53
State Government
336
0.00
Indian Public
90,72,342
30.58
Total
2,96,61,733
100.00
Promotor group
Indian Public
Corporate Bodies
Insurance Companies
Mutual Funds
NRIs | OCBs
Banks
2010-11
%
2011-12
50.10
45.66
30.58
9.74
4.45 4.26
0.53 0.34
0.53
0.40
1.82
4.91
14.39
32.29