


 21 / 140

19
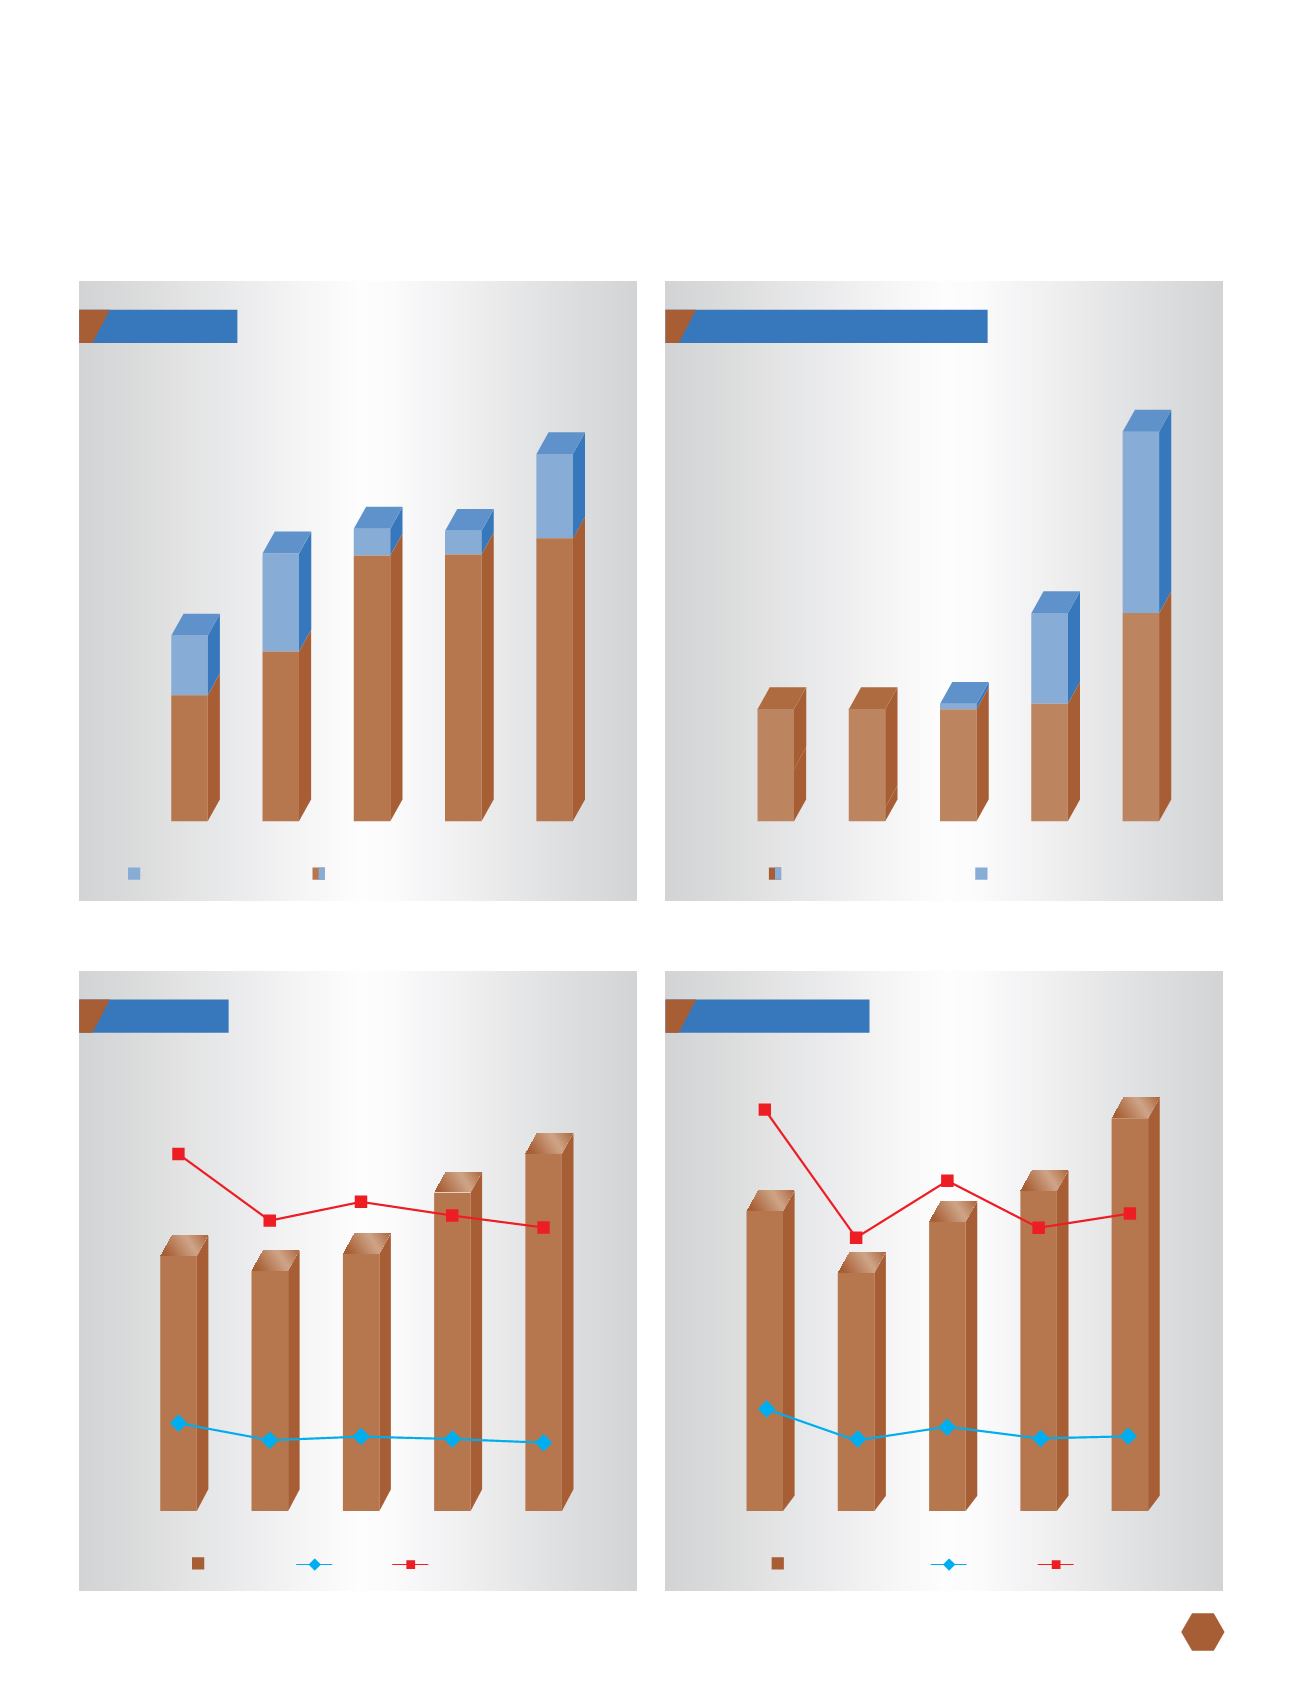
Fixed Assets
`
cr
700
800
900
1000
1100
2011-12
2010-11
2009-10
2008-09
2007-08
Additions during the year
Gross block excluding capital work-in-progress
818
859
949
950
965
56
874
22
972
79
1044
25
974
92
951
Investment in Group Companies
`
cr
0
10
20
30
40
50
60
70
80
2011-12
2010-11
2009-10
2008-09
2007-08
Investment at original cost
Investment during the year
21
21
949
39
21
39
34
73
25
22
21
21
22
17
1
Inventories
`
cr
%
0
50
100
150
200
250
300
350
2011-12
2010-11
2009-10
2008-09
2007-08
0
5
10
15
20
25
Inventories
NoDs
% to sales
209
72
20.9%
17.0%
18.1%
17.3% 16.6%
58
61
59
56
197
211
261
293
Trade Receivables
`
cr
%
0
50
100
150
200
250
300
350
400
2011-12
2010-11
2009-10
2008-09
2007-08
0
5
10
15
20
25
30
Trade receivables
NoDs
% to sales
281
96
28.2%
19.2%
23.2%
19.9%
20.9%
66
79
68
70
223
271
300
368