


 20 / 140

Atul Ltd | Annual Report 2011-12
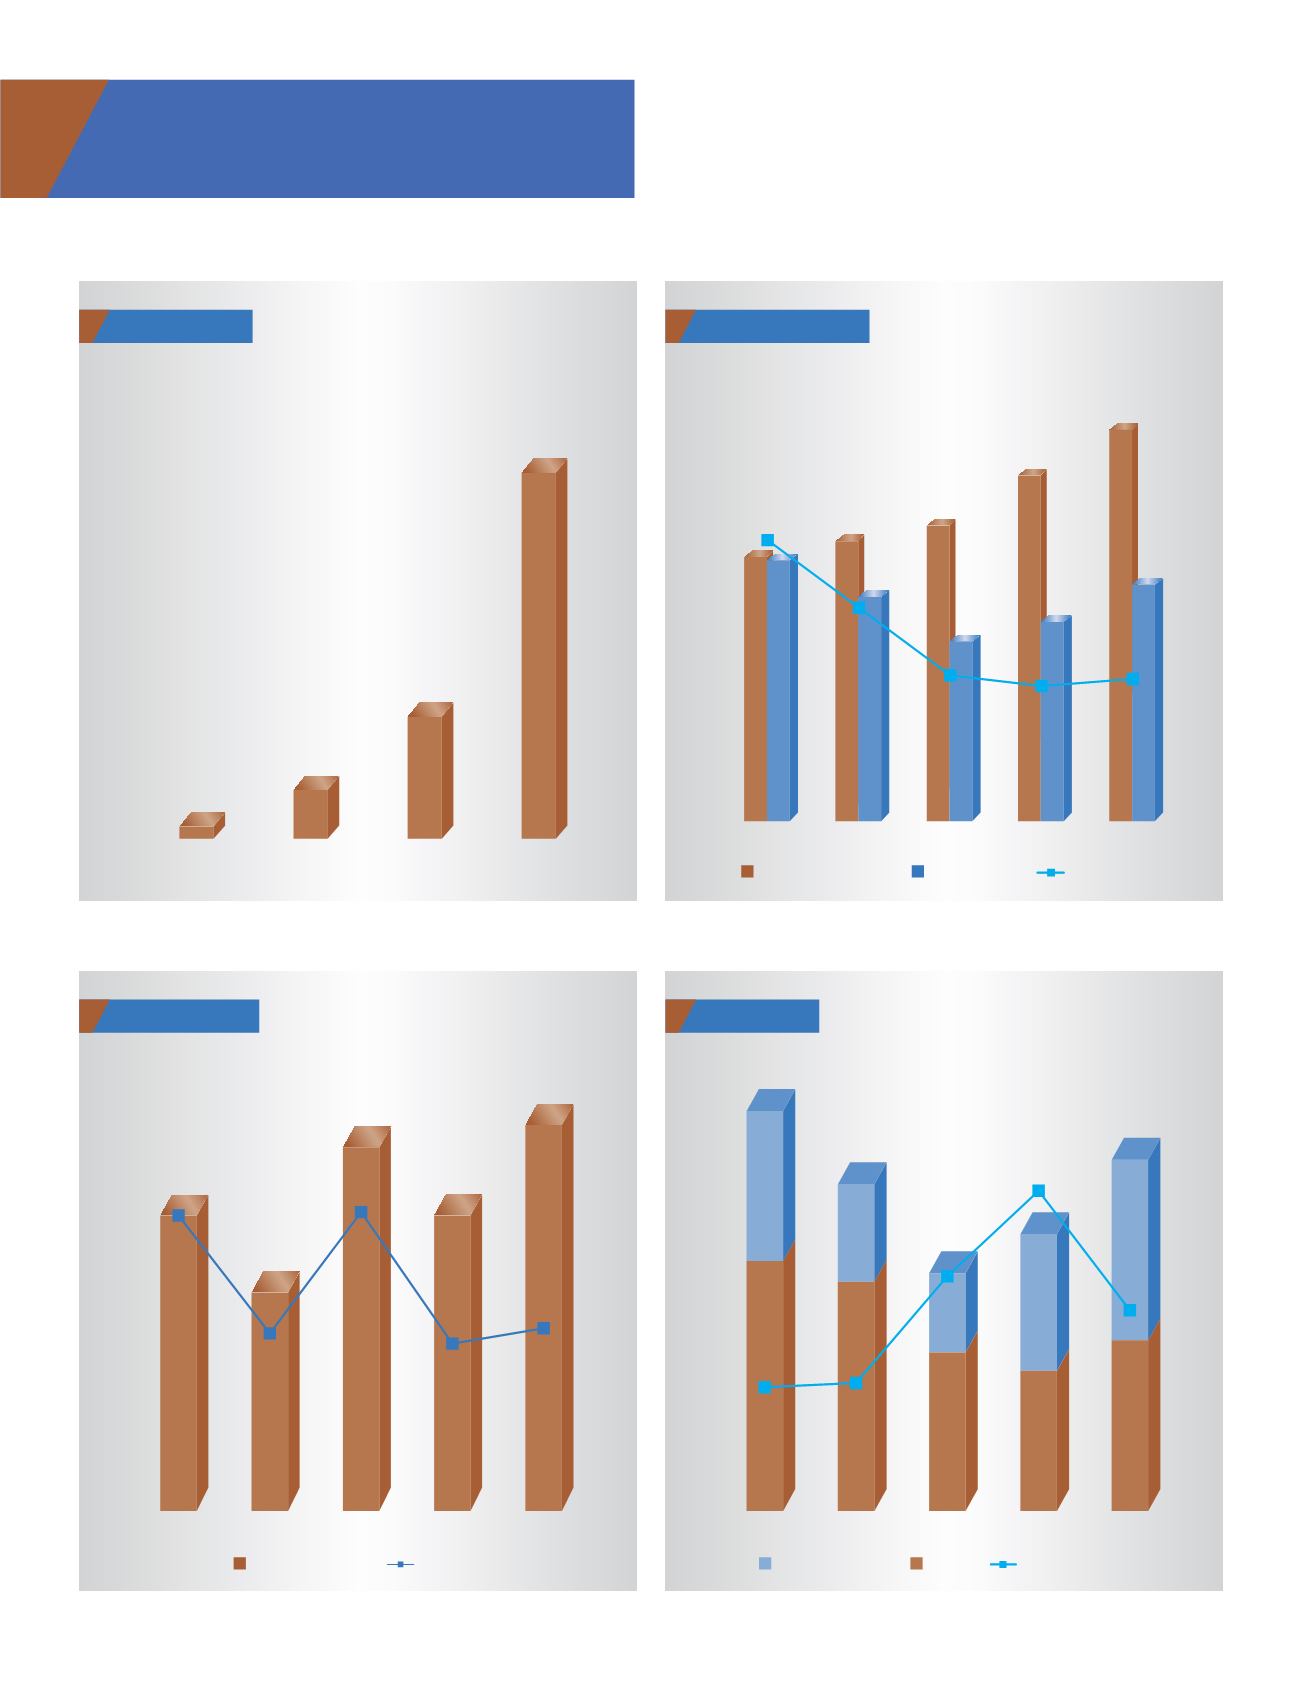
Share Capital
`
cr
0
5
10
15
20
25
30
35
1
4
10
30
1952
1972
1992
2012
Debt-Equity
`
cr
0
100
200
300
400
500
600
700
2011-12
2010-11
2009-10
2008-09
2007-08
433
0.99
0.80
0.61
0.58
0.60
428
459
485
567
642
388
327
295
368
0.2
0.4
0.6
0.8
1.0
1.2
1.4
Shareholders’fund
Borrowings
Debt-equity ratio
Trade Payables
`
cr
%
50
100
150
200
250
300
2011-12
2010-11
2009-10
2008-09
2007-08
5
10
15
20
25
30
Trade payables
% to Sales
223
22.3%
15.4%
22.5%
14.8%
15.7%
178
263
223
276
Borrowings
`
cr
100
150
200
250
300
350
400
450
2011-12
2010-11
2009-10
2008-09
2007-08
Foreign currency
Rupee
Interest coverage ratio
123
305
288
230
215
112
148
240
65
80
3.0
7.5
4.7
0
1
2
3
4
5
6
7
8
9
10
5.5
2.9
Financial Charts