


 18 / 140

Atul Ltd | Annual Report 2011-12
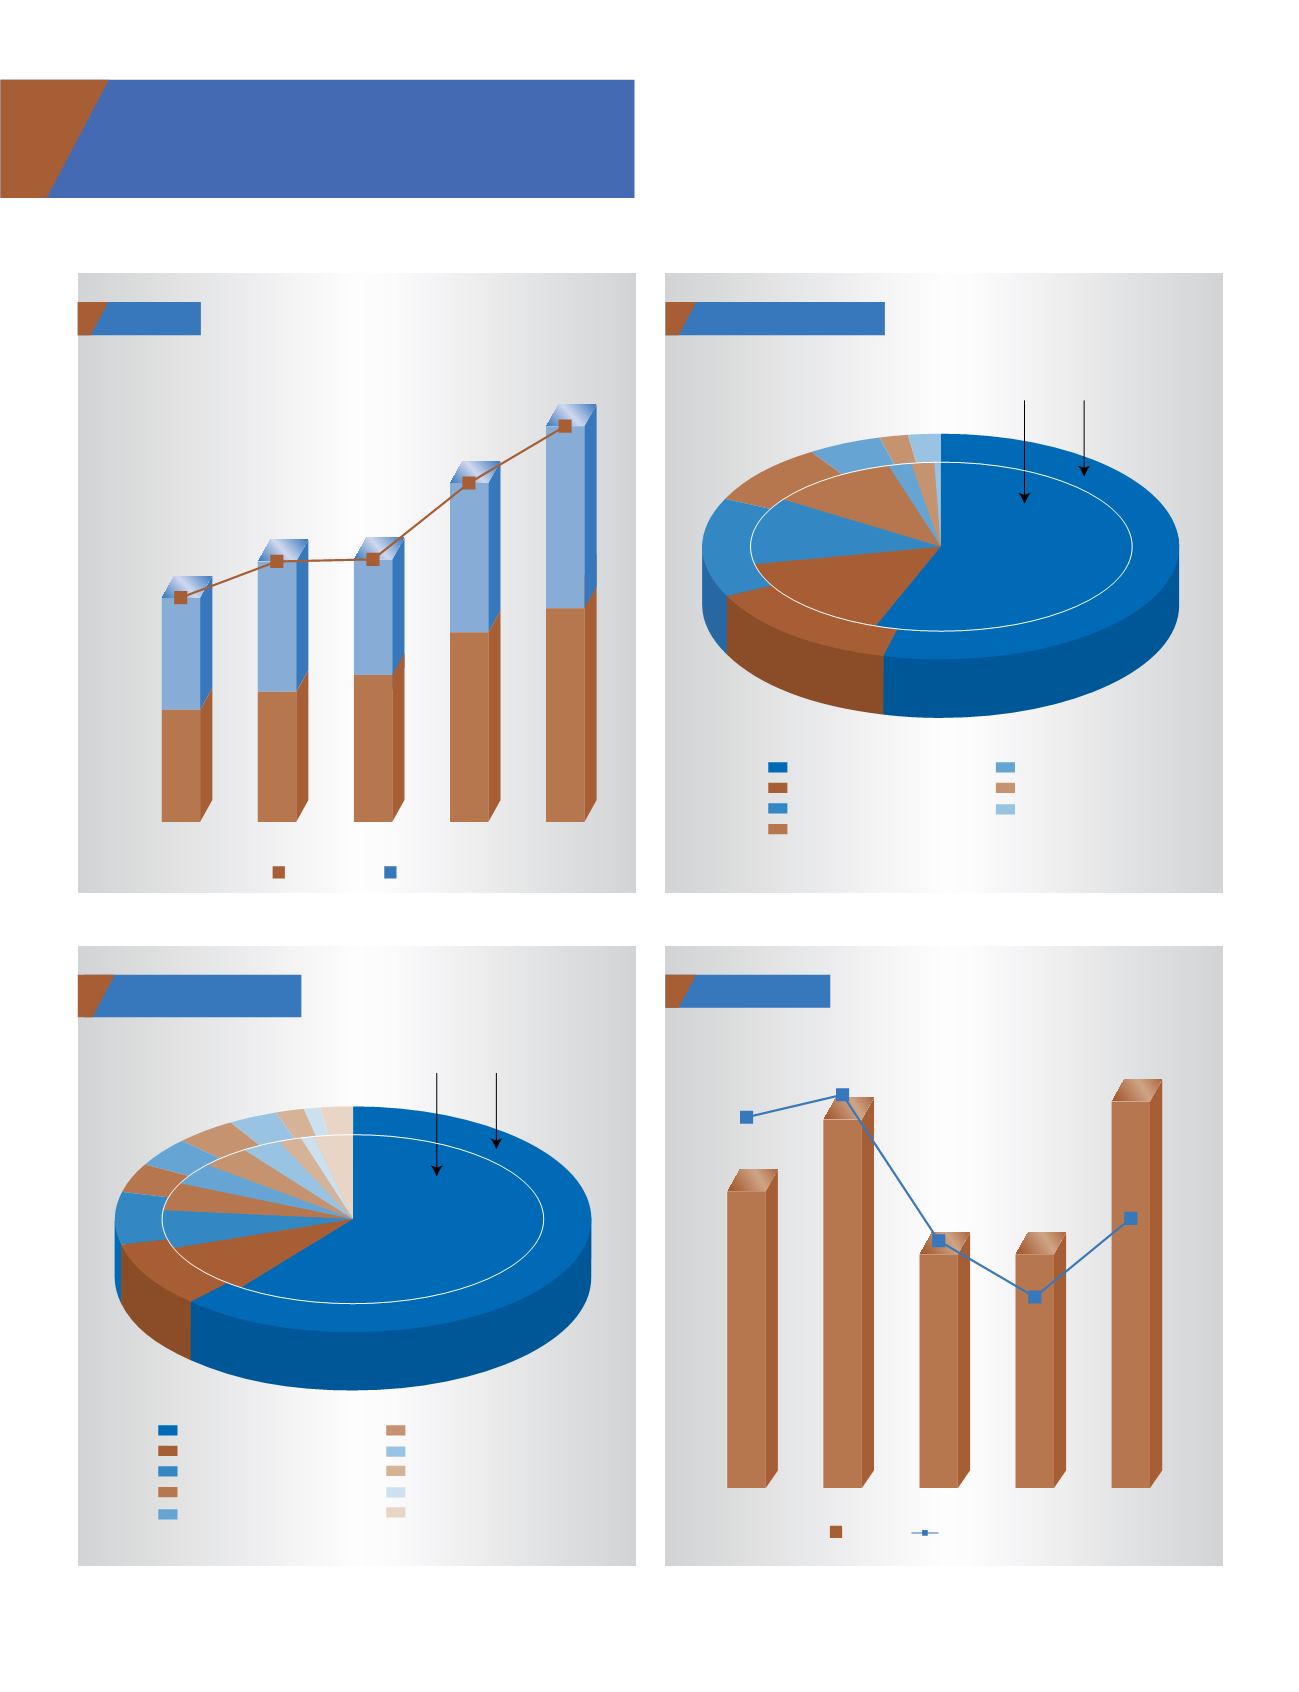
Financial Charts
Sales
`
cr
998
1159
1168
1508
1761
0
200
400
600
800
1000
1200
1400
1600
1800
2000
2011-12
2010-11
2009-10
2008-09
2007-08
Domestic
Export
50%
50%
50%
44%
56%
44%
56%
46%
54%
50%
CAGR: 15%
16%
1%
29%
17%
India
Asia (excluding India)
Europe
North America
South America
Africa
Australia
Sales by Geography
2010-11
%
2011-12
54
56
14
14
9
5 2 2
2 2
11
13
16
Expenses
(% of Operating Revenue)
Raw materials
Power, fuel & water
Employees
Selling & distributions
Others
Repairs & maintenance
Depreciation
Interest & finance charges
Exchange difference
Tax
2010-11
2011-12
59
57
9
7
4
4
4
3 2 1 2
3123
4
4
5
7
9
Finance Cost
`
cr
0
5
10
15
20
25
30
35
40
45
50
2011-12
2010-11
2009-10
2008-09
2007-08
0.0
0.4
0.8
1.2
1.6
2.0
2.4
2.8
3.2
3.6
4.0
Interest
41
26
26
43*
33
Interest cost as % to sales
* Includes AS-16 impact of
`
12 cr
3.3%
3.5%
2.2%
1.7%
2.4%
%