


 15 / 140

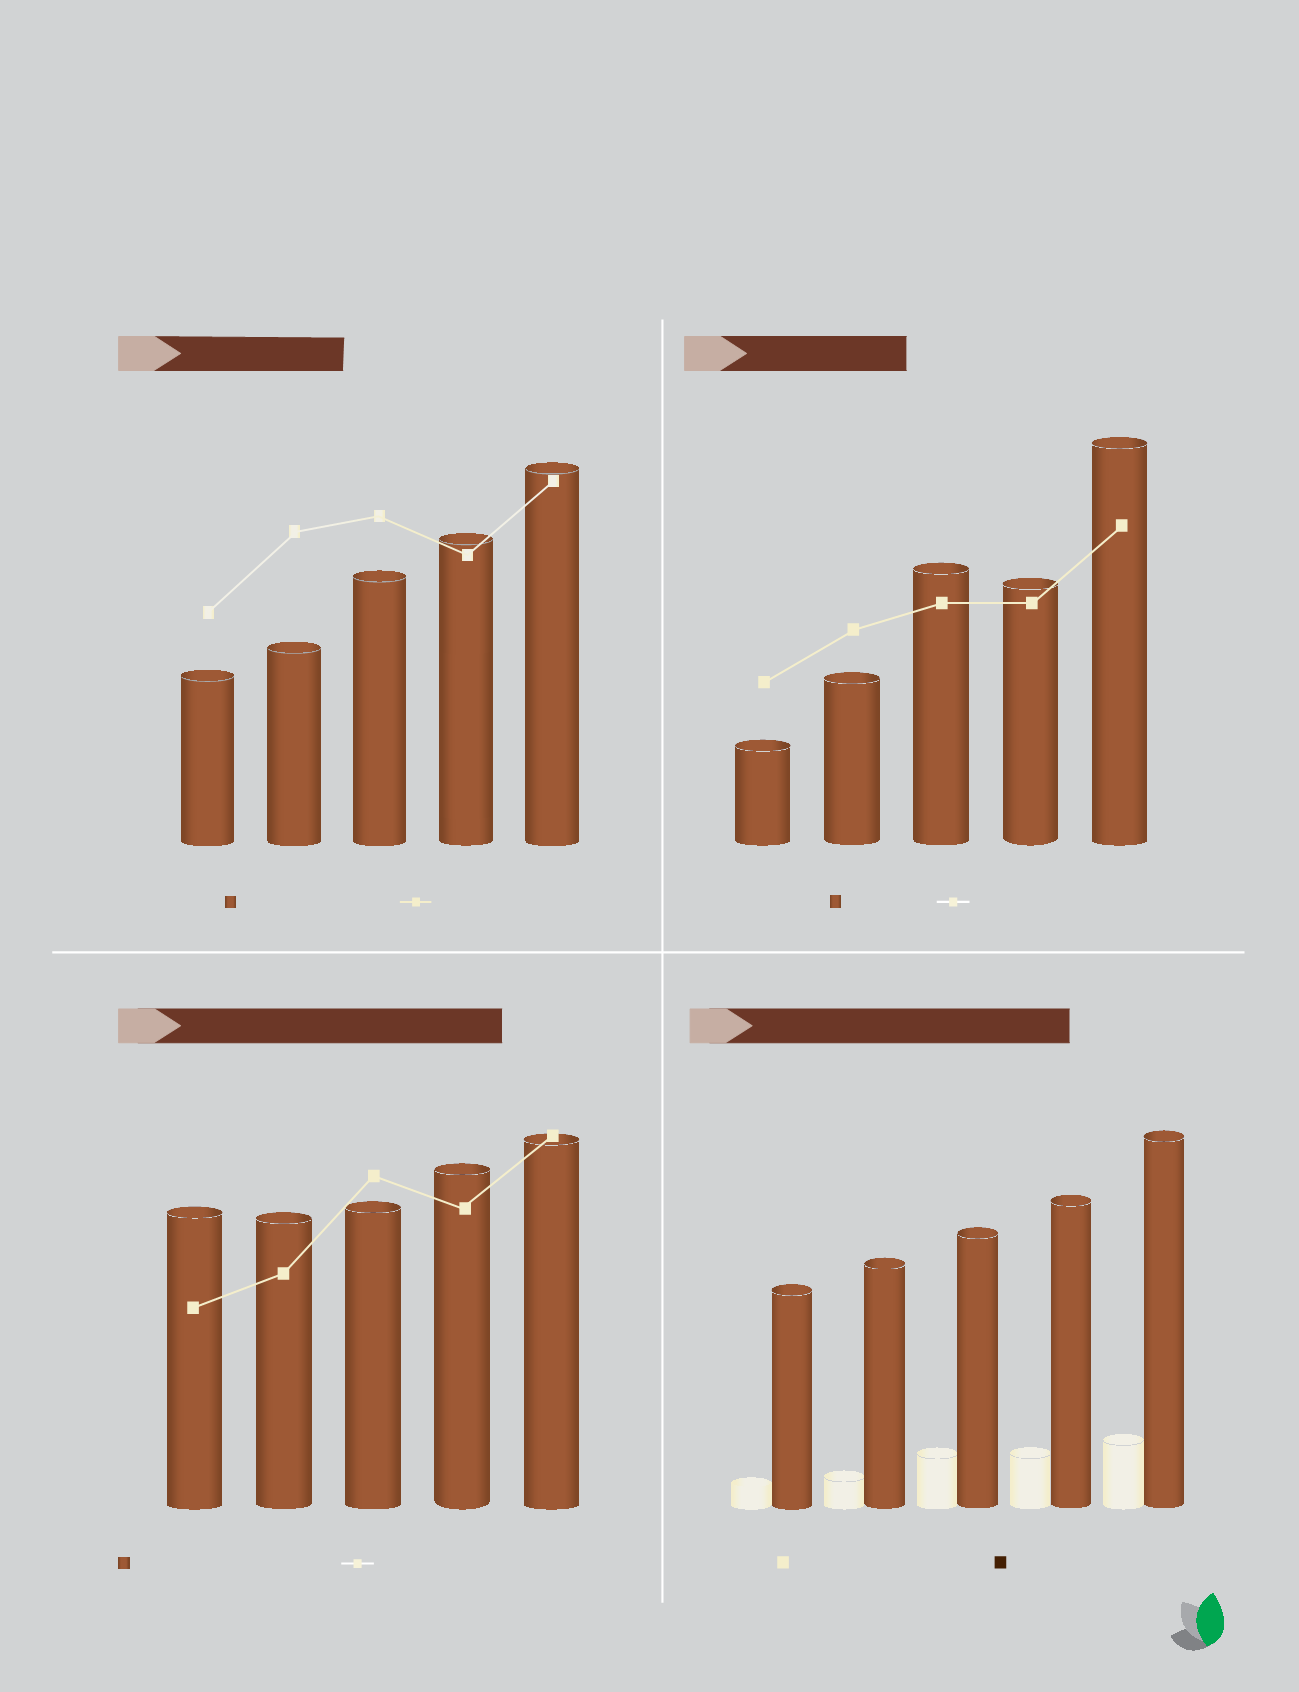
Operating EBIDTA
Return on Average Capital Employed
Profit Before Tax
Earning and Book Value Per Share
0
5
50
7
150
11
200
13
300
15
CAGR: 23%
CAGR: 38%
CAGR
EPS: 30%
Book Value: 12%
%
250
100
9
`
cr
10.7%
12.2%
12.9%
11.6%
13.7%
124
143
194
269
2008-09 2009-10 2010-11 2011-12 2012-13
Operating EBIDTA
Operating EBIDTA %
0
40
30%
40%
200
120
160
80
`
cr
0
10
20
30
50
80
60
70
40
%
2008-09 2009-10 2010-11 2011-12 2012-13
46
80
139
122
192
PBT
Dividend %
45% 45%
60%
0
0
200
4
100
2
1,200
24
1,100
22
600
12
500
10
800
16
900
18
1,000
20
700
14
400
8
300
6
`
cr
%
2008-09 2009-10 2010-11 2011-12 2012-13
822
810
840
939
1,041
Average capital employed*
*Excludingcapitalwork-in-progress
#Excludingexceptional income |expenses
Return on average capital employed%#*
21.1%
16.9%
13.1%
11.2%
18.5%
203
0
50
100
150
250
155
13
19
30
30
46
164
191
216
255
300
200
`
2008-09 2009-10 2010-11 2011-12 2012-13
Book value per share
Earning per share
13