


 16 / 136

14 /
Atul Ltd |
Annual Report 2009-10
Investments
The Company invested its operational surplus in its
business. Other investments remained more or less
unchanged at Rs 65 crores.
Inventories
Inventory constituted 34% of current assets as on March
31, 2010. Inventory value marginally increased by 7% from
Rs 197 crores as on March 31, 2009 to Rs 211 crores as on
March 31, 2010. Inventory days stood at 66 days during
the year against 62 days in the previous year.
Debtors
Debtors constituted 43% of the current assets as on March
31, 2010. Debtors increased by 22% from Rs 223 crores as
on March 31, 2009 to Rs 271 crores as on March 31, 2010
due to substantial increase in sales during the last quarter
of the year as compared to the previous year. Debtor days
stood at 81 days during the year against 66 days in the
previous year.
Loans and Advances
Loans and advances increased by 18% from Rs 110 crores
as on March 31, 2009 to Rs 130 crores as on March 31,
2010. The increase was mainly attributable to balance with
Government suppliers | departments.
Current Liabilities
Current liabilities increased by 48% from Rs 178 crores as
on March 31, 2009 to Rs 263 crores as on March 31, 2010
primarily due to our focus on improving working
capital position.
Income
Sales volume on an average grew by 18%. However
operating revenues at Rs 1,198 crores recorded only an
insignificant growth of less than 1% mainly due to a
decline in the prices of raw materials and consequently
those of finished goods. Exports declined by 11% to Rs
513 crores due to the economic slowdown in the USA
and Europe. However, domestic sales at Rs 655 crores
grew by 12% and made up for the lower exports.
15
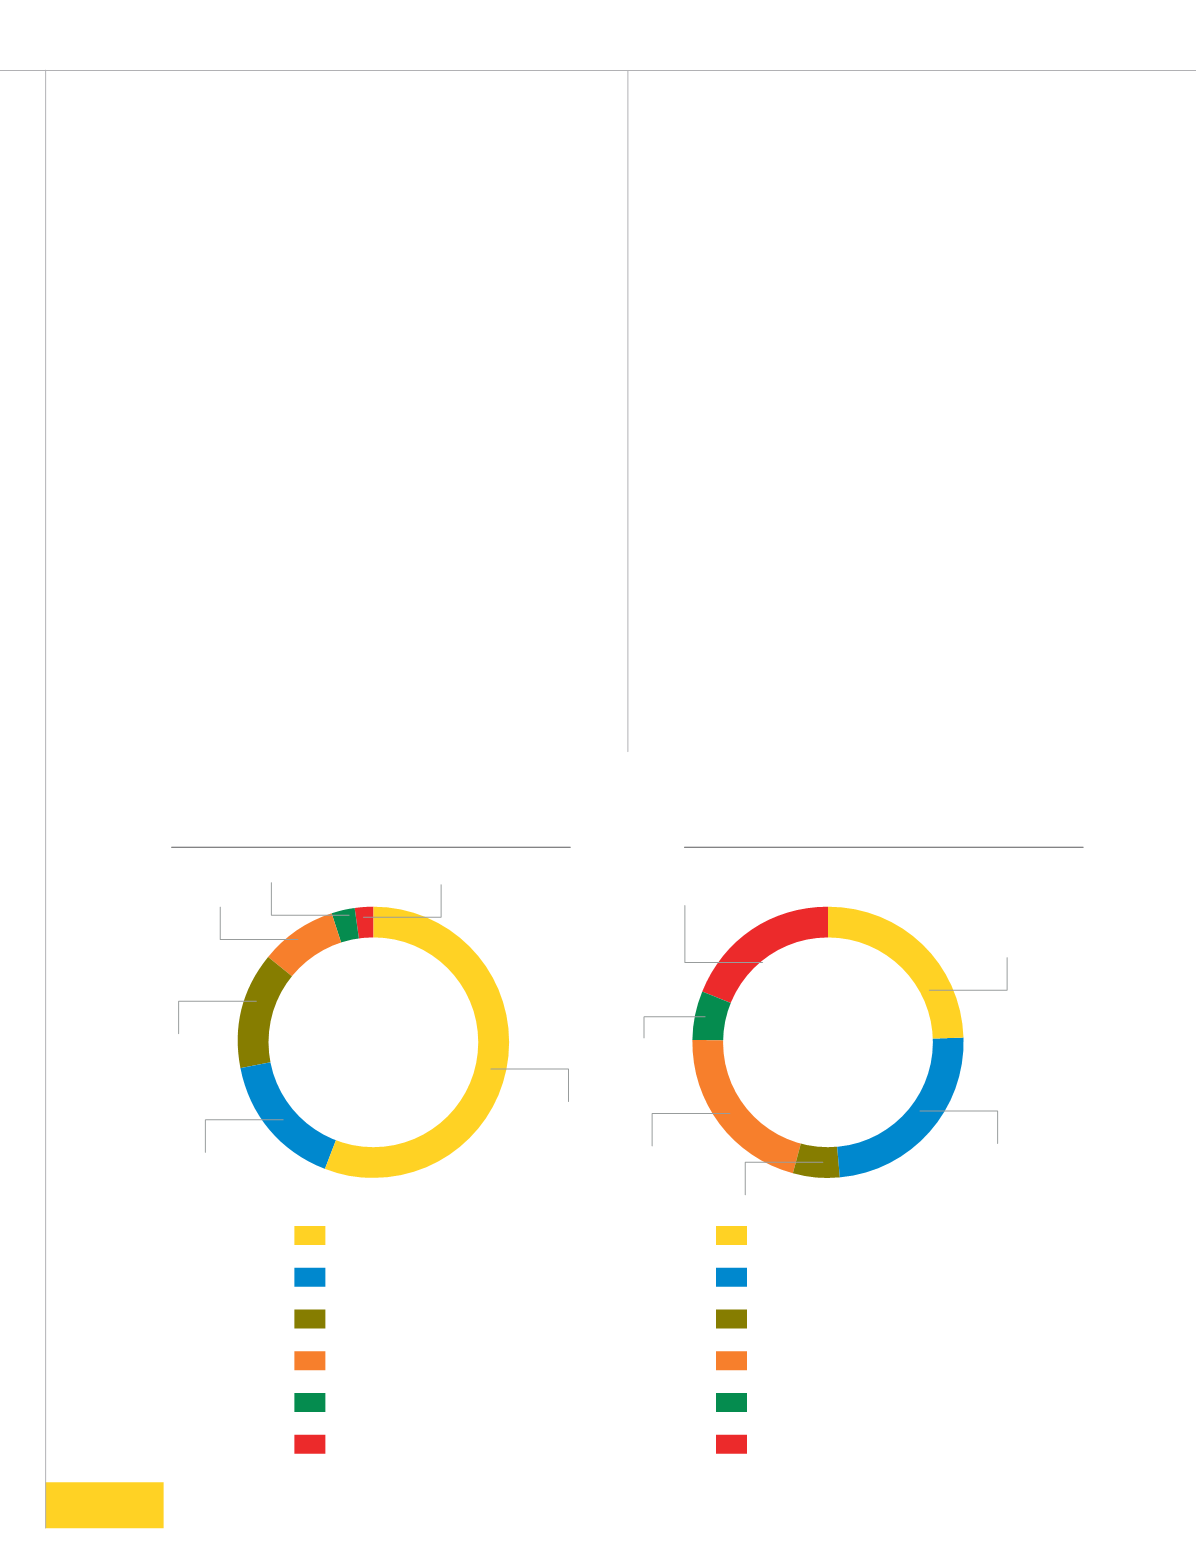
Colors
Aromatics
Bulk Chemicals and Intermediates
Crop Protection
Pharma and Intermediates
Polymers
24
24
21
6
19
6
Revenues by business
India
Asia
Europe
North America
South America
Africa
Sales by geography
56
16
14
9
3
2
(%)
(%)