


 196 / 236

Atul Ltd | Annual Report 2016-17
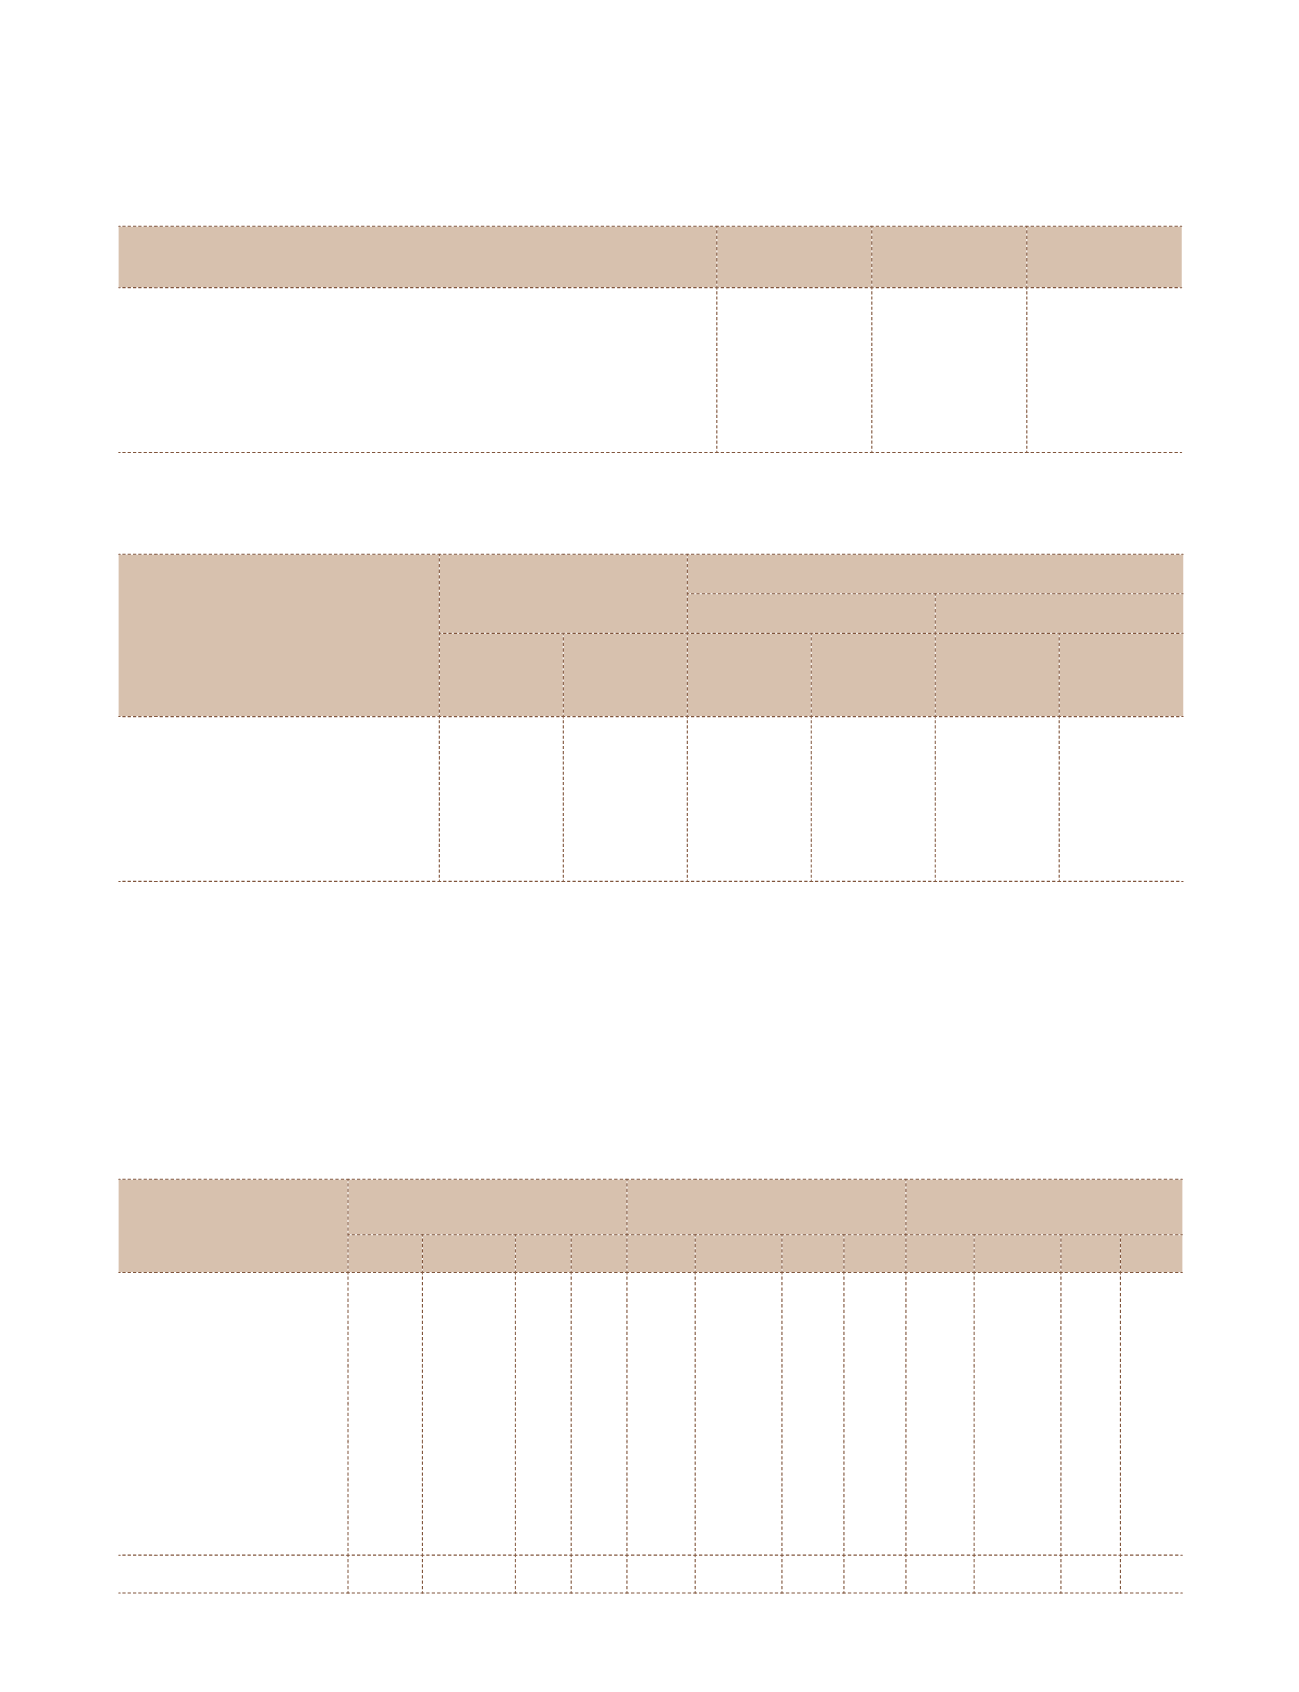
Significant estimates: Actuarial assumptions and sensitivity
The significant actuarial assumptions were as follows:
Particulars
As at
March 31, 2017
As at
March 31, 2016
As at
April 01, 2015
Discount rate
7.22%
7.80%
7.99%
Attrition rate
7.30%
7.00%
7.00%
Rate of return on plan assets
7.22%
7.80%
7.99%
Salary escalation rate
7.75%
7.75%
7.75%
Sensitivity analysis
The sensitivity of the defined benefit obligation to changes in the weighted principal assumptions is:
Particulars
Change in assumptions
Impact on defined benefit obligation
Increase in assumptions
Decrease in assumptions
As at
March 31,
2017
As at
March 31,
2016
As at
March 31,
2017
As at
March 31,
2016
As at
March 31,
2017
As at
March 31,
2016
Discount rate
1.00% 1.00% (3.92%)
(3.92%)
4.31% 4.31%
Attrition rate
1.00% 1.00% (0.06%)
(0.06%)
0.06% 0.06%
Rate of return on plan assets
1.00% 1.00% (3.92%)
(3.92%)
4.31% 4.31%
Salary escalation rate
1.00% 1.00% 4.27% 4.27% (3.96%)
(3.96%)
The above sensitivity analyses are based on a change in an assumption while holding all other assumptions constant.
In practice, this is unlikely to occur, and changes in some of the assumptions may be correlated. When calculating the
sensitivity of the defined benefit obligation to significant actuarial assumptions the same method (present value of the
defined benefit obligation calculated with the projected unit credit method at the end of the reporting period) has been
applied as when calculating the defined benefit liability recognised in the Balance Sheet.
The methods and types of assumptions used in preparing the sensitivity analysis did not change as compared to the
prior year.
Major category of plan assets are as follows:
(
`
cr)
Particulars
As at
March 31, 2017
As at
March 31, 2016
As at
April 01, 2015
Quoted Unquoted Total
in % Quoted Unquoted Total
in % Quoted Unquoted Total
in %
Government of India
assets
–
1.27 1.27 2.67% –
1.27 1.27 2.67% –
1.52 1.52 3.40%
Debt instruments
Corporate bonds
1.22
– 1.22 2.67% 1.27
– 1.27 2.67% 1.35
– 1.35 3.02%
Investment funds
Insurance fund
44.71
0.13 44.84 94.42% 39.80
0.11 39.91 83.93% 38.45
0.24 38.69 86.59%
Others
–
–
–
–
–
4.94 4.94 10.39% –
2.96 2.96 6.63%
Special deposit scheme
–
0.16 0.16 0.34% –
0.16 0.16 0.34% –
0.16 0.16 0.36%
45.93
1.56 47.49 100% 41.07
6.48 47.55 100% 39.80
4.88 44.68 100%
Notes
to the Consolidated Financial Statements